Over 15 years ago, we asked investors to place their trust in us as stewards of their hard-earned wealth. Few things in life move in a straight line, especially not investing. The road occasionally gets bumpy, and we knew we’d often find ourselves with very little company along the way.
Time has many benefits – one of them is providing perspective. We can look back at the decisions we took and their outcomes – specifically how our willingness to look different from the crowd defines both our first 15 years and the ones to come.
“Safety” in numbers?
Humans are wired to survive in crowds. Herding is part of our evolution – it’s much safer to be surrounded by others versus being lone prey crossing the desert solo. In nature, independence usually goes unrewarded and often results in disaster.
On the other hand, investing is generally the complete opposite. The roar of the crowd can be a distraction, giving a false sense of security.
History has shown that some of the riskiest periods existed when there wasn’t a wall of worry in investors’ minds, and vice versa – some of the most opportune times occurred when the irresistible pull of fear was the strongest.
In the face of uncertainty, we have remained focused on our competitive strengths. This means sticking to our deceptively simple investment approach and trying to operate in a narrow emotional band.
The Road Not Taken
By Robert Frost
Two roads diverged in a yellow wood,
And sorry I could not travel both
And be one traveler, long I stood
And looked down one as far as I could
To where it bent in the undergrowth;
Then took the other, as just as fair,
And having perhaps the better claim,
Because it was grassy and wanted wear;
Though as for that the passing there
Had worn them really about the same,
And both that morning equally lay
In leaves no step had trodden black.
Oh, I kept the first for another day!
Yet knowing how way leads on to way,
I doubted if I should ever come back.
I shall be telling this with a sigh
Somewhere ages and ages hence:
Two roads diverged in a wood, and I-
I took the one less traveled by,
And that has made all the difference.
That’s not to say we’ve been right with every investment. In fact, we wear our mistakes like tattoos, openly talking about and updating them annually on our website. The truth is that when you invest for a long time, you don't remember the successful investments as well as you remember the mistakes.
A lot happened over the first 15 years of our journey alongside our investors. What's stayed the same has always been (and will continue to be) our investment approach – business owners buying businesses. We take ownership stakes in businesses by conducting fundamental analysis and developing proprietary insights.
We don’t invest in businesses because of macro thoughts, however we keep macro-level market issues in mind when looking for potential risks or what to avoid. We’ve always done our best to communicate those risks to the likeminded investors willing to join us along the way.
Let’s take a walk down memory lane to revisit some of the times where we took the path less travelled and ended up far from the maddening crowd.
2008 to 2009
Non-obvious survivors
“If you know what everyone knows, you know nothin’ at all”
The Financial Crisis delivered market volatility not seen since the Great Depression. At the height of this uncertainty, the average investor was questioning whether the financial system would collapse. History has shown that in times of extreme fear, investors migrate towards “safety-type” businesses – what we referred to as obvious survivors. Essentially, investors felt safest with the essentials – grocery stores, packaged goods companies and utilities because people would always need food, personal goods, electricity and phone service. Many market participants found solace by flocking to these sectors.
We saw little opportunity in sectors where everyone was crowding. Moreover, we believed owning these businesses could be risky because investing with the consensus opinion historically hasn’t been financially rewarding.
Likewise, we saw little opportunity in businesses that required the economy to grow to experience growth themselves. Examples included most big leisure companies and the majority of the large transportation companies. Our belief was that that the global economy may be sluggish for longer than people expect, and therefore, businesses that require the economy to drive their growth may not be good investments.
Our focus turned to the non-obvious survivors that could grow irrespective of what happened (within reason) in the economy. Said another way, we looked for businesses that we thought could double in size over a period of five to seven years, where we weren't being asked to pay for that growth in earnings power. Examples of these types of businesses include Ryanair, a low-cost airline, and Pool Corp., a U.S. distributor of pool supplies.
Looking back at our first five years, it’s “obvious” that the path less travelled was the right long-term choice:
Total annualized returns (C$)
Annualized total returns, net of fees (excluding advisory fees), in C$EdgePoint Global Portfolio - Series F
YTD: 0.00%; 1-year: 5.92%; 3-year: 8.78%; 5-year: 6.93%; 10-year: 9.96%; 15-year: 13.10%; Since inception (Nov. 17, 2008): 13.49%
MSCI World Index
YTD: 2.54%; 1-year: 17.14%; 3-year: 9.69%; 5-year: 11.78%; 10-year: 11.14%; 15-year: 12.03%; Since inception (Nov. 17, 2008): 11.75%
MSCI World Consumer Staples Index
YTD: 1.90%; 1-year: 1.95%; 3-year: 6.05%; 5-year: 6.97%; 10-year: 8.38%; 15-year: 10.04%; Since inception (Nov. 17, 2008): 9.73%
MSCI World Utilities Index
YTD: -1.97%; 1-year: -3.04%; 3-year: 2.40%; 5-year: 4.77%; 10-year: 7.50%; 15-year: 5.73%; Since inception (Nov. 17, 2008): 5.69% Source: FactSet Research Systems Inc. Series F is available to investors in a fee-based/advisory fee arrangement and doesn’t require EdgePoint to incur distribution costs in the form of trailing commissions to dealers. The MSCI World Index was chosen as the benchmark for the EdgePoint Global Portfolio because it’s a widely used benchmark of the global equity market. The MSCI World Consumer Staples Index and MSCI World Utilities Sector Index are shown to represent where investors perceived safety due to consistent consumer demand during a volatile period. The indexes are not investible. See Important information – benchmarks and indexes for additional details.
2010 to 2011
Slower for longer
In 2010, the mantra was the “New Normal” – a macro economic landscape which included high unemployment levels, household deleveraging, sovereign debt risks, austerity measures and the inflation/deflation battle. 2011 brought on another wave of concerns – a U.S. debt downgrade, European debt crisis and a potential slowdown in China. The consensus view was a slower-for-longer world, a view that we shared.
With the glass seemingly half-empty for many investors, they decided to fill their portfolios with the “safest” of options – cash and fixed income securities like 10-year Government of Canada bonds. Everyone expected to be “paid to wait” in government bonds until the global economy improved. The view was that global equity markets didn’t offer an attractive investment opportunity as bonds. In reality, anyone buying bonds at then-prevailing yields was locking in a near-guaranteed loss after adjusting for inflation if held to maturity. “Guaranteed loser” is not our definition of “safe.”
What the average investor seemed to forget was that safety is a function of the price that was paid for it. Pay too much and that “safe” investment can be the riskiest thing to own.
We continued with our focus on finding companies such as German engine manufacturer Tognum AG (now Rolls-Royce Power Systems AG) and medical-packaging manufacturer Gerresheimer AG that could grow regardless of the economy. This meant capitalizing on the prevailing outlook by investing in resilient businesses with solid growth potential that were being ignored by a highly pessimistic market.
Those who paid for the short-term peace of mind were rewarded in the long term with a return that barely beat inflation as evidenced by the ICE BofA Canada Broad Market Index (which includes Canadian government and corporate investment grade bonds).
Total annualized returns (C$)
Annualized total returns, net of fees (excluding advisory fees), in C$ EdgePoint Global Portfolio - Series F
YTD: 0.00%; 1-year: 5.92%; 3-year: 8.78%; 5-year: 6.93%; 10-year: 9.96%; 15-year: 13.10%; Since inception (Nov. 17, 2008): 13.49%
MSCI World Index
YTD: 2.54%; 1-year: 17.14%; 3-year: 9.69%; 5-year: 11.78%; 10-year: 11.14%; 15-year: 12.03%; Since inception (Nov. 17, 2008): 11.75%
ICE BofA Canada Broad Market Index
YTD: -1.36%; 1-year: 2.10%; 3-year: -2.91%; 5-year: 0.74%; 10-year: 2.02%; 15-year: 3.18%; Since inception (Nov. 17, 2008): 3.32% Source: FactSet Research Systems Inc. The MSCI World Index was chosen as the benchmark for the EdgePoint Global Portfolio because it’s a widely used benchmark of the global equity market. The ICE BofA Canada Broad Market is shown to represent where investors perceived safety of fixed income during a volatile period. The indexes are not investible. See Important information – benchmarks and indexes for additional details.
2013
Canada – the one-trick moose?
At the end of 2012, what the average Canadian investor saw was a market that had outperformed both U.S and international indexes over 10 and 20 years:
| Region | Index | 10-Year | 20-Year |
|---|
Investors in the S&P/TSX Composite Index probably thought they were investing in Canada. Looking deeper showed that they were relying on an idea focused on other regions – China and the emerging markets. Their rapid growth made them the largest consumers of commodities. Almost 50% of the Canadian index was in energy and materials (precious and base metals). These segments were tied closely to the fortunes of China and emerging markets. The result of their economic growth was an increased demand for commodities, directly impacting the price of energy and materials. Investors expected that demand for natural resources would march steadily higher.
We saw significant risk in being overexposed to one idea. As a by product of this, our Canadian Portfolio’s combined weight in energy and materials was half of the index’s.
Sector breakdown
Dec. 31, 2012

Source, index: FactSet Research Systems Inc. In C$. The S&P/TSX Composite was chosen as the benchmark for the EdgePoint Canadian Portfolio because it’s a widely used benchmark of the Canadian equity market. See Important information – benchmarks and indexes for additional details.
Close to the index, the average fund in the Canadian Equity Fund category at the time had a 37% weight in energy/materials.i
The mutual fund industry incentivizes portfolio managers to follow the same road as their benchmark index. Tracking benchmark results lowers career risk – you aren’t penalized for looking different when it goes down and are guaranteed a similar reward if it goes up. It’s a perfect example of the old saying: “It’s easier to fail conventionally than succeed unconventionally.”
At EdgePoint we view risk as permanent loss of capital. To us, that’s real risk and it has to do with factors that can go wrong with the underlying fundamentals of an investment versus tracking a benchmark’s holdings.
The permanent loss of whose capital?
Compensation relative to an index inadvertently redefines risk. Instead of seeing risk as the potential for permanent loss of investors’ capital, portfolio managers in our industry are more concerned with the “risk” to their year-end bonus resulting from not owning a particular company or sector that’s popular in the index. Pretty perverse, isn’t it?
So, how did our unconventional approach fare against the S&P/TSX Composite Index over the next five years?
Total annualized returns (C$)
Annualized total returns, net of fees (excluding advisory fees), in C$EdgePoint Canadian Portfolio - Series F
YTD: 3.38%; 1-year: 16.81%; 3-year: 22.79%; 5-year: 15.76%; 10-year: 10.83%; 15-year: 13.39%; Since inception (Nov. 17, 2008): 13.53%
S&P/TSX Composite Index
YTD: 0.55%; 1-year: 4.62%; 3-year: 9.91%; 5-year: 9.57%; 10-year: 7.59%; 15-year: 9.29%; Since inception (Nov. 17, 2008): 9.14%Source: FactSet Research Systems Inc. The S&P/TSX Composite Index was chosen as the benchmark for the EdgePoint Canadian Portfolio because it’s a widely used benchmark of the Canadian equity market. The index is not investible. See Important information – benchmarks and indexes for additional details.
2018 to 2020
The dangers of reaching for yield
“There’s no such thing as a (risk-)free lunch"
A decade after the Financial Crisis, the effect of multi-year low interest rates took their toll on fixed income investors. Since companies could borrow money at low rates, the debt they issued came with a lower interest payment and therefore a lower yield.ii One way to boost yield was to go further out on the yield curve by buying bonds with longer duration, meaning higher sensitivity to interest rate changes.iii The index was happy to do so, regardless of the additional risk. The "investment" supermarket firms capitalized on this by launching high income/high yield funds.
We warned clients about the extreme level of complacency in fixed income markets. It was the forgotten part of people’s portfolios that many hoped they could just set and forget. We recognized that lower yields had forced the crowd to reach for what was available and that there were more risks in the system than many were willing to acknowledge.
As the yield came down, the duration (or level of risk) kept increasing. That’s the definition of reaching for yield.
ICE BofA Canada Broad Market Index Yield-to-Maturity vs. Duration
Jun. 30, 1992 to Dec. 31, 2021
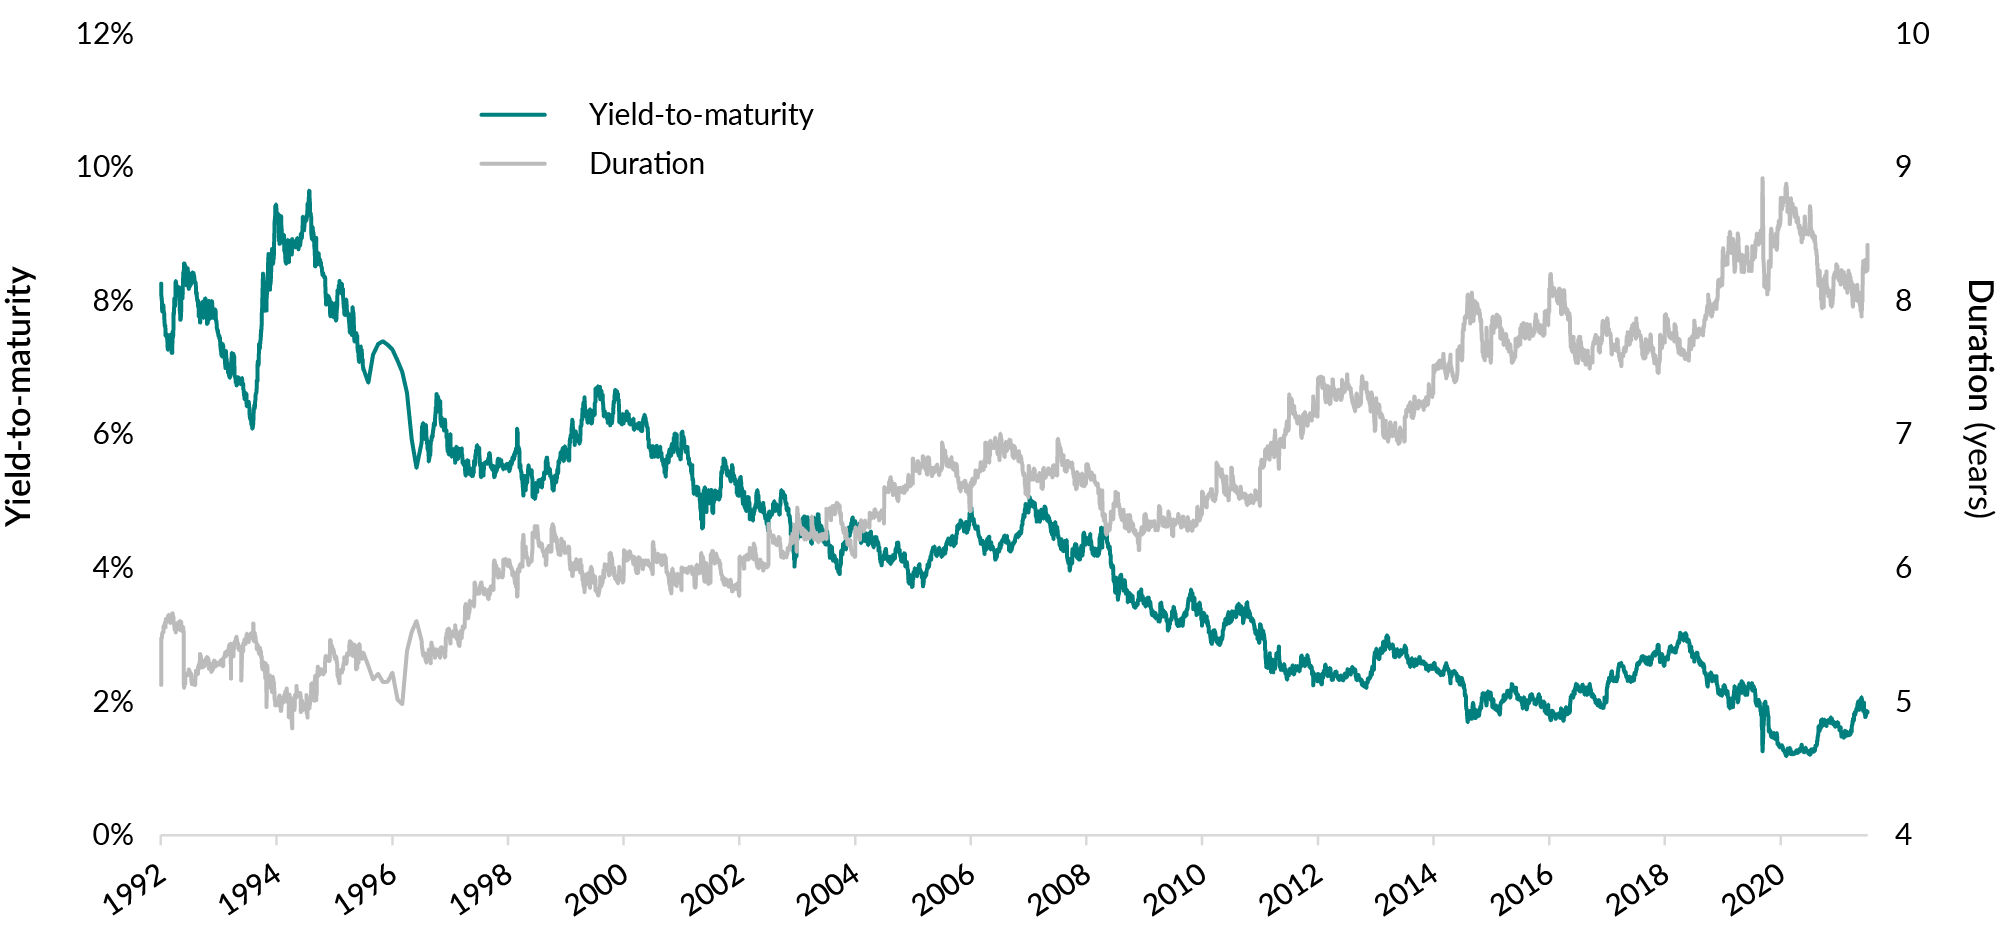
Source: Bloomberg LP. The ICE BofA Canada Broad Market Index is shown to represent the Canadian fixed income market. See Important information – benchmarks and indexes and Importation information – definitions for additional details.
When everyone perceived long-duration bonds to be safe, our belief was this asset class had become very risky. We pointed out that a long history of low rates had provided a nice tailwind for a generation of fixed income investors. They thought such a favourable environment would last forever, but we opted for a different approach that didn’t rely on historically low rates moving even lower. We kept our duration short in our EdgePoint Global and Canadian Growth & Income Portfolios (less than one quarter of the index) to protect against the prospect of rising rates and enable us to reinvest our maturing principal payments into a more-favourable market as they rose.
By 2020, the fixed income bull market was about 40 years old. Rates continued to drop while the world stayed home because of COVID-19. We didn’t run a standalone prospectus fixed income mutual fund, but felt we had a responsibility to make our advisor partners aware of the risks we were seeing in the space.
Here was the list of Canadian bond funds that we sent in an Email to our advisor partners in the middle of 2020. These were actual funds sold by a “who’s who” in the industry, but we altered the names to protect the “not-so-innocent":
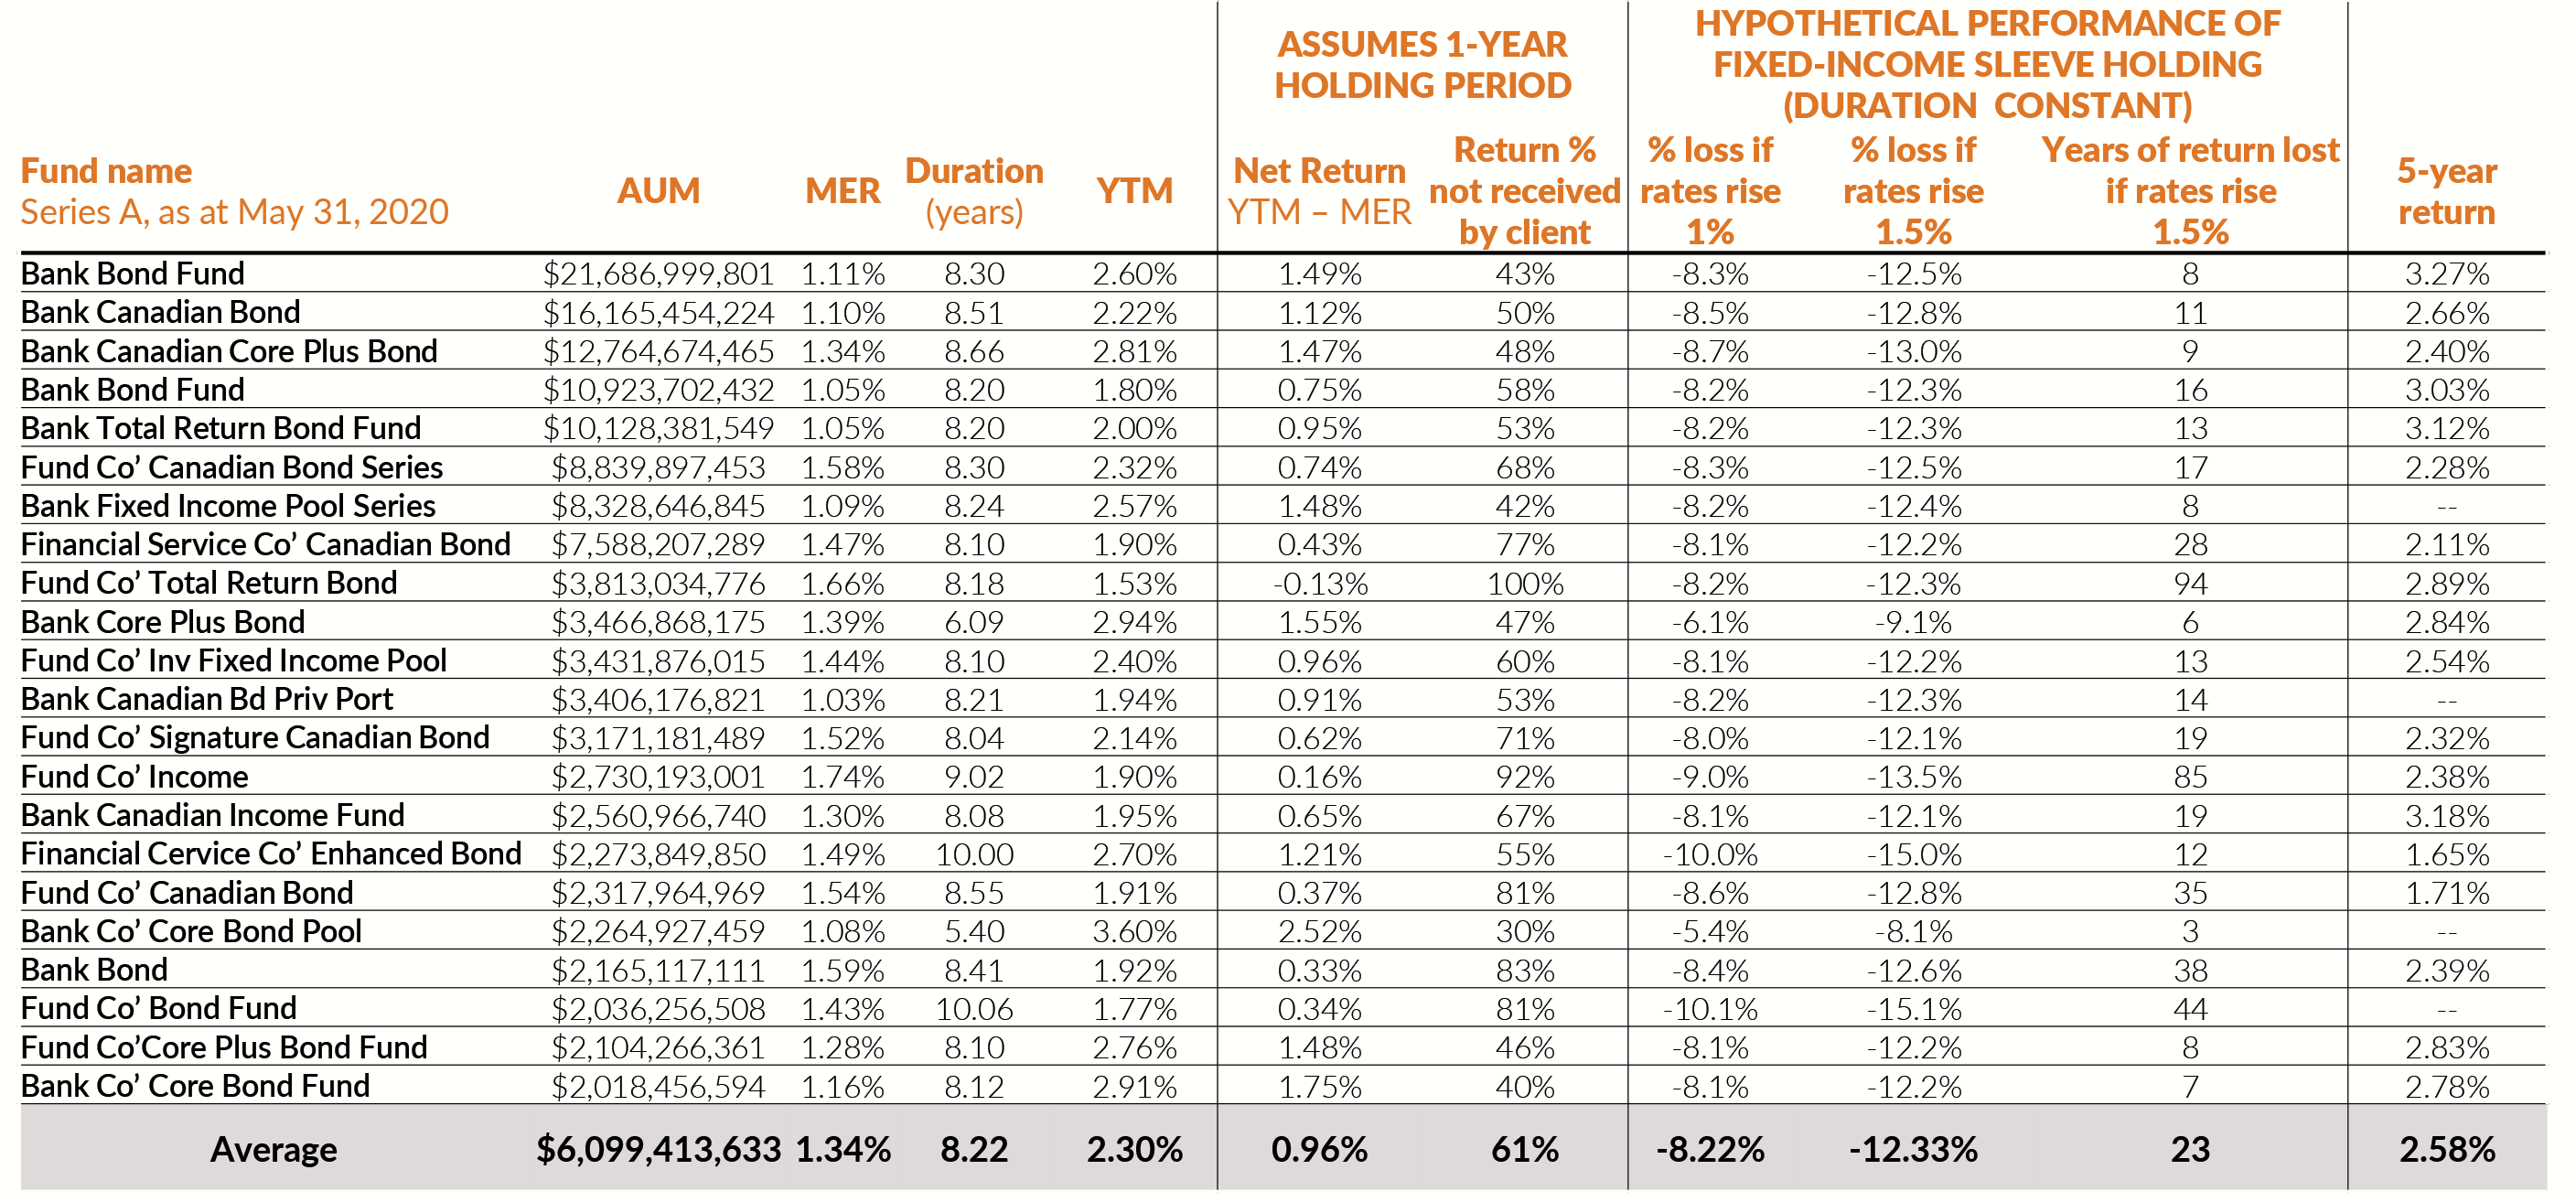
Source: Morningstar Direct. Total annualized return in C$. AUM and 5-year return as at May 31, 2020. The universe of funds analyzed only includes funds with available duration and yield-to-maturity values, as well as a minimum AUM of $2 billion in the Canadian Fixed Income category. Series A MER, duration and yield-to-maturity taken directly from fund websites. If not disclosed on fund websites, Morningstar was used. “Return % not received by client” is calculated as the MER divided by the fund’s YTM and assumes a one-year holding period. “Years of return lost if rates rise 1.5%” was calculated as the “% loss if rates rise 1.5%” divided by the “Net Return.” The U.S. 10-year Government Bond was used to represent rate increases in the hypothetical performance examples above.
The numbers behind the largest Canadian fixed income funds weren’t pretty. The average portfolio had a duration of 8.2, yield-to-maturity of 2.30% and an MER of 1.34%.
Assuming the 10-year Treasury bond yield moved up by 1.5% (basically back to where we were pre-COVID-19), then the client would lose more than 12% of their investment.
If nothing changed, then the average investor in these funds would make 1% annually for eight years (i.e., slowly going broke after accounting for inflation). The “set-and-forget" part of their portfolio was suddenly “set-and-forget about getting to point B.”
We can’t predict macro events like rate changes, but we knew they were going to move eventually. If rates went up, the crowd who had over $134 billion invested in these funds would be hurt. That amount of money implied a strong bet that rates would go down – DOWN from the lowest point in history.
Despite not having an alternative standalone fund to offer, we recognized the inherent risks and made it our mission to alert our advisor partners so they could keep their clients from getting caught in a potential “income trap.” fund. The conversations weren’t always easy, but we felt it was the right thing to do for our partners and their clients.
Unfortunately for many investors who stayed in these funds, we now know that interest rates did go up.
The following chart compares the returns of the fixed income portion of our EdgePoint Global and Canadian Growth & Income Portfolios against the average return of the funds from the previous Email and the overall Canadian bond market.
Total annualized returns (C$)
Annualized total returns, net of fees (excluding advisory fees), in C$ EdgePoint Canadian Growth & Income Portfolio, Series F
YTD: 2.43%; 1-year: 12.01%; 3-year: 15.32%; 5-year: 11.89%; 10-year: 8.95%; 15-year: 11.36%; Since inception (Nov. 17, 2008): 11.33%
EdgePoint Canadian Growth & Income Portfolio (fixed income only)
YTD: 0.62%; 1-year: 7.93%; 3-year: 5.75%; 5-year: 5.71%; 10-year: 4.78%; 15-year: 6.52%; Since inception (Nov. 17, 2008): 6.24%
EdgePoint Global Growth & Income Portfolio, Series F
YTD: 0.42%; 1-year: 6.35%; 3-year: 7.83%; 5-year: 6.42%; 10-year: 8.40%; 15-year: 11.38%; Since inception (Nov. 17, 2008): 11.32%
EdgePoint Global Growth & Income Portfolio (fixed income only)
YTD: 0.68%; 1-year: 7.65%; 3-year: 4.68%; 5-year: 4.86%; 10-year: 4.20%; 15-year: 6.37%; Since inception (Nov. 17, 2008): 6.06%
ICE BofA Canada Broad Market Index
YTD: -1.36%; 1-year: 2.10%; 3-year: -2.91%; 5-year: 0.74%; 10-year: 2.02%; 15-year: 3.18%; Since inception (Nov. 17, 2008): 3.32%Source, EdgePoint fixed income and index returns: FactSet Research Systems Inc. Total returns, net of fees (excluding advisory fees), in C$. EdgePoint Growth & Income Portfolios fixed income holdings performance figures shown for illustrative purposes only and aren’t indicative of future performance. They aren’t intended to represent returns of an actual fixed income fund as they weren’t investible. EdgePoint Growth & Income Portfolio fixed income performance figures are net of fees and approximations calculated based on end-of-day holdings data (actual trading prices not captured). A hypothetical management expense ratio (MER) of 0.62% was applied to the EdgePoint Growth & Income Portfolios fixed income returns and prorated daily. The fixed income MER was calculated based on the average MER for EdgePoint Global and Canadian Growth & Income Portfolios (0.84% and 0.86%, respectively). The average Canadian fixed income fund return is the simple average return of funds in the previous table that was included on the Email sent by EdgePoint to advisor partners on July 8, 2020. The ICE BofA Canada Broad Market Index was chosen as the benchmark for the fixed income portion of the EdgePoint Growth & Income Portfolios because it’s a widely used benchmark of the Canadian fixed income market. The index and the average of the Canadian fixed income funds are not investible. See Important information – benchmarks and indexes for additional details.
2019
Oil and gas
The dirtiest words in investing
In 2019 Canadian oil and gas was the world’s most-out-of-favour industry, spurred on by misguided ESG-related initiatives. Over our many years of investing, we’ve learned that such negative sentiment starts becoming the underpinnings for longer-term value creation if the investment can overcome the reasons for falling out of favour in the first place.
We aren’t aware of any energy fund launches at the time – other than our prospectus-exempt Portfolio available to accredited investors that invested in the unloved western Canadian energy businesses (which you can read about here). We believe in energy transition, but it needs a thoughtful strategy for gradually weaning off oil and gas – and the world is still unprepared yet to function without them.
Over four years later, the commodity has stayed true to its pattern of high volatility from big swings in supply and demand. Given the COVID-19 pandemic and certain geopolitical issues that have greatly impacted the prices of oil and gas, it’s certainly been a wild, if lonely, ride. The annualized return of the S&P/TSX Composite Energy Index since we launched our Portfolio on November 22, 2019 has been 20%.iv
Regarding our Portfolio, it’s closed to new investors and we look forward to returning money to existing investors once we believe the opportunity in this space has ended.
2021
Why Canada
Unlike 2013, the average investor wanted nothing to do with Canada almost a decade later. Money continued to flow out of domestic funds.
Mutual fund net sales by asset class (C$B)
Taking a different path than the crowd, we saw an opportunity in the widest valuation discrepancy between the S&P/TSX Composite and the S&P 500 Indexesin over a decade. We believed the crowd was overlooking good opportunities to invest domestically.
Forward price-to-earnings ratios – S&P/TSX Composite Index relative to S&P 500 Index
2001 to 2021
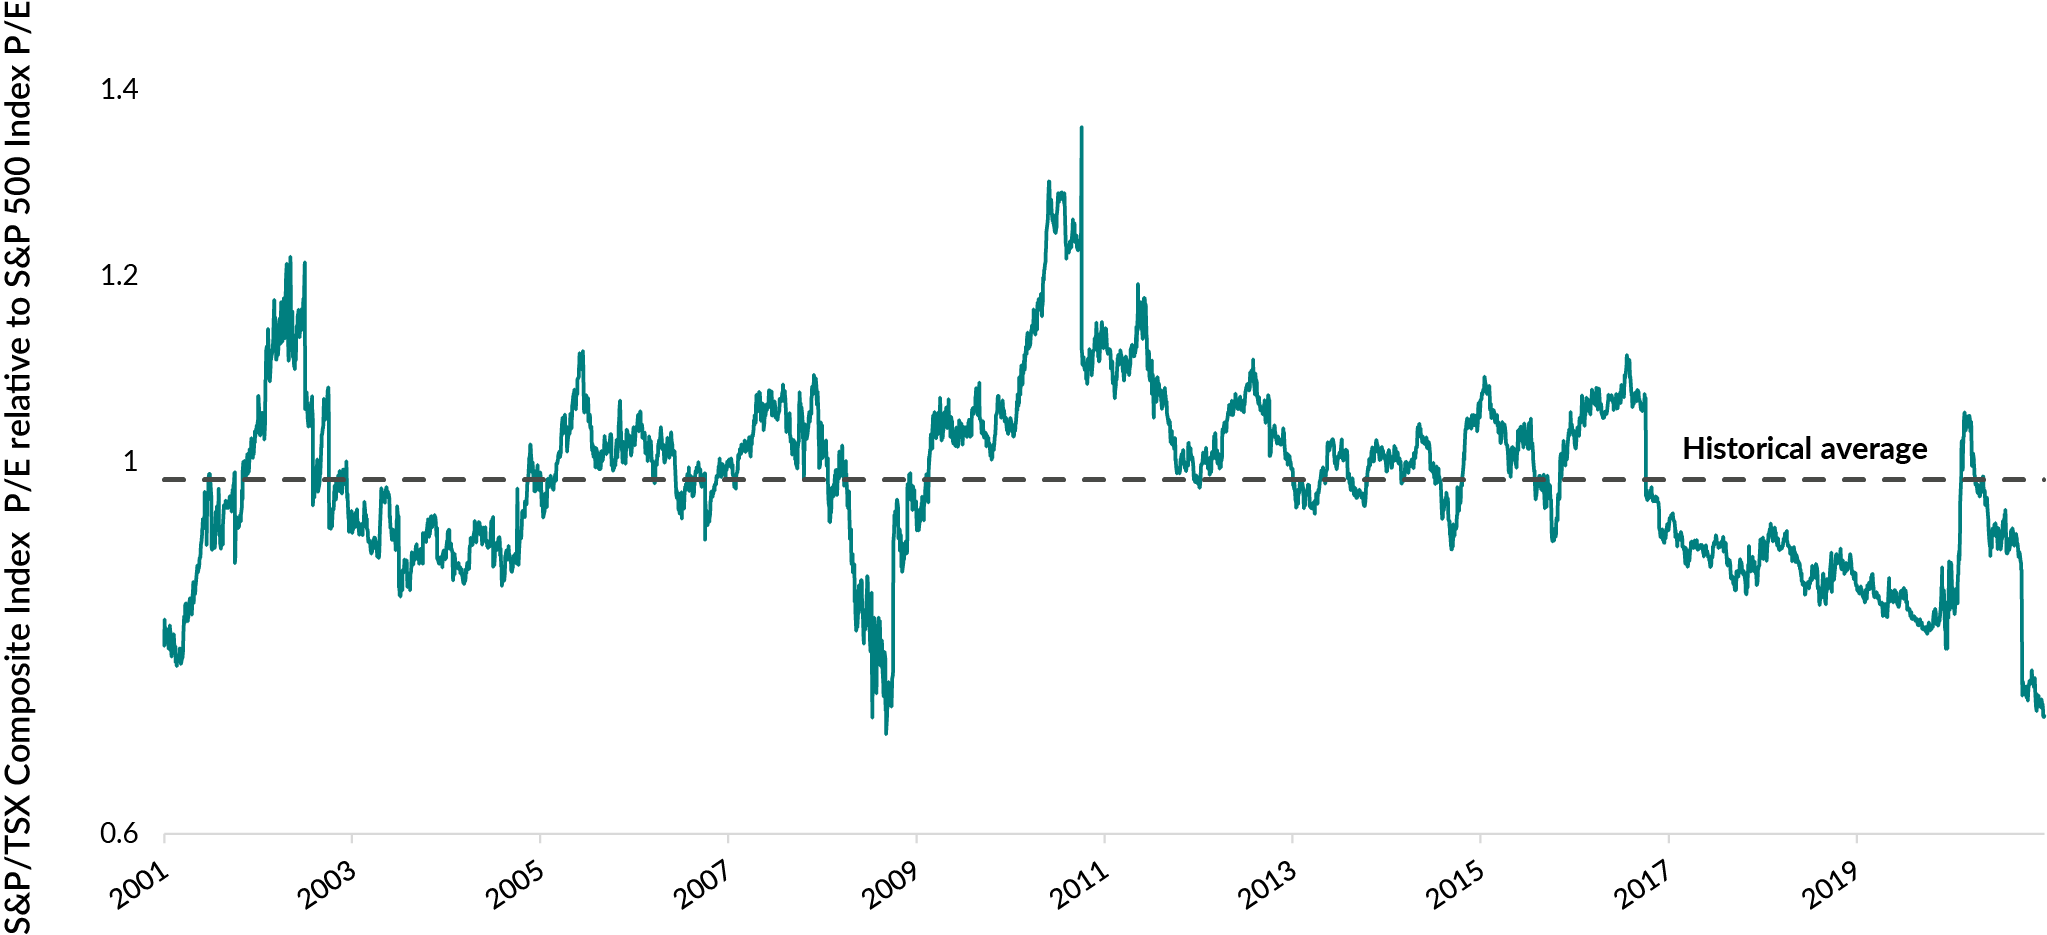
Source: Bloomberg LP. Chart displayed from April 2, 2001 to March 30, 2021. Price-to-earnings ratios are using forward consensus earnings per share estimates in calculations. Consensus earnings as at March 31, 2021. The indexes are not investible. See Important information – benchmarks and indexes for additional details.
A byproduct of this conviction was the Canadian allocation in our Global Portfolio and Cymbria (both global mandates) reaching its highest level in both Portfolios’ history:
Historical weight of Canadian businesses in EdgePoint Global Portfolio and Cymbria
As at Feb. 28, 2021

Weights rounded to the nearest decimals. EdgePoint Wealth Management excluded from Cymbria’s Canadian content weight.
We were joined on this unpopular road by the management teams of our existing Canadian businesses as they bought back shares to capitalize on the lower prices:
| EdgePoint Canadian Portfolio: Top holding examples | Portfolio weight (Feb. 28, 2021) | 2020 share repurchases (C$M) |
|---|
Fast forward three years, the Canadian index has outperformed the MSCI World Index. We believe in owning businesses, not the market. Our proprietary insights into predominantly Canadian companies resulted in EdgePoint Canadian Portfolio materially outperforming during this time frame.
Total annualized returns (C$)
Annualized total returns, net of fees (excluding advisory fees), in C$ EdgePoint Canadian Portfolio - Series F
YTD: 3.38%; 1-year: 16.81%; 3-year: 22.79%; 5-year: 15.76%; 10-year: 10.83%; 15-year: 13.39%; Since inception (Nov. 17, 2008): 13.53%
S&P 500 Index
YTD: 3.00%; 1-year: 20.38%; 3-year: 12.14%; 5-year: 14.11%; 10-year: 14.03%; 15-year: 14.66%; Since inception (Nov. 17, 2008): 14.30%
S&P/TSX Composite Index
YTD: 0.55%; 1-year: 4.62%; 3-year: 9.91%; 5-year: 9.57%; 10-year: 7.59%; 15-year: 9.29%; Since inception (Nov. 17, 2008): 9.14%
MSCI World Index
YTD: 2.54%; 1-year: 17.14%; 3-year: 9.69% 5-year: 11.78%; 10-year: 11.14%; 15-year: 12.03%; Since inception (Nov. 17, 2008): 11.75% Source: FactSet Research Systems Inc. The S&P/TSX Composite Index was chosen as the benchmark for the EdgePoint Canadian Portfolio because it’s a widely used benchmark of the Canadian equity market. The S&P/TSX Composite Index, S&P 500 Index and MSCI World Index are shown as a comparison of equity investments between geographic sectors.. The indexes are not investible. See Important information – benchmarks and indexes for additional details.
Today
Looking at the headlines today, it’s easy to see the road chosen by the crowd. Tech stock share prices have been fueled by what they can do in the future with the promise of artificial intelligence and other innovations in our life. Flows in tech dwarf other sectors.
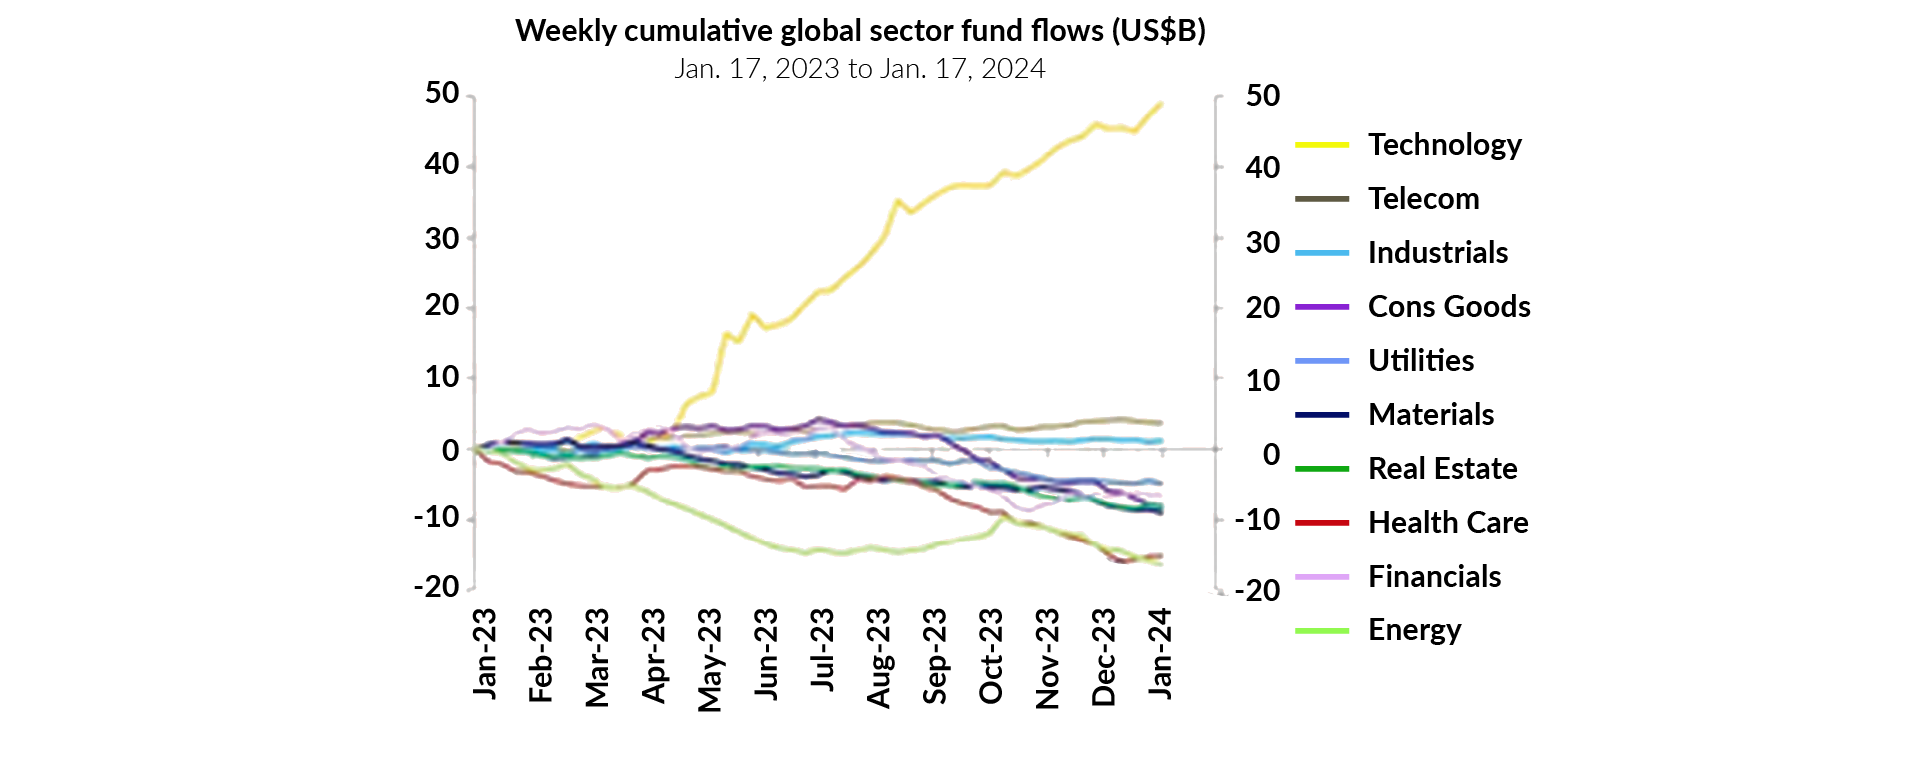
Source: Deutsche Bank Asset Allocation. In US$. As at January 17, 2024.
Some of the early winners at the start of the 2020s that were seen as disruptors during COVID-19 (e.g., WeWork and Peloton) have in turn seen their share prices disrupted. The crowd has moved on to the "Magnificent Seven" (Apple, Microsoft, Amazon, Alphabet, Tesla, Nvidia and Meta). These businesses are household names – their stocks move the needle on market performance and are taking seemingly everyone along for the ride. We don’t know if this is a bubble, but only time will tell.
The view from the top isn’t always pretty. History has shown that, on average, companies joining the largest 10 names experienced high returns on the way there. Unfortunately, their fairy tales usually didn’t have happy endings after joining the top 10:
10-largest U.S. stocks by market cap – total annualized excess returns relative to the U.S. market
Today, in a market overshadowed by the top 7 companies, we believe there’s opportunity in looking beyond the mega-cap names. As more money managers gravitate towards owning the largest companies to minimize their risk of underperforming the index, there’s been less focus towards the mid-cap space. Many of these companies are well established with long track records and dominant positions in their respective markets, yet their relative valuation is much lower than their large-cap counterparts:
S&P 100 Index vs. S&P 400 MidCap Index Relative valuations (average)
Dec. 31, 1999 to Dec. 31, 2023
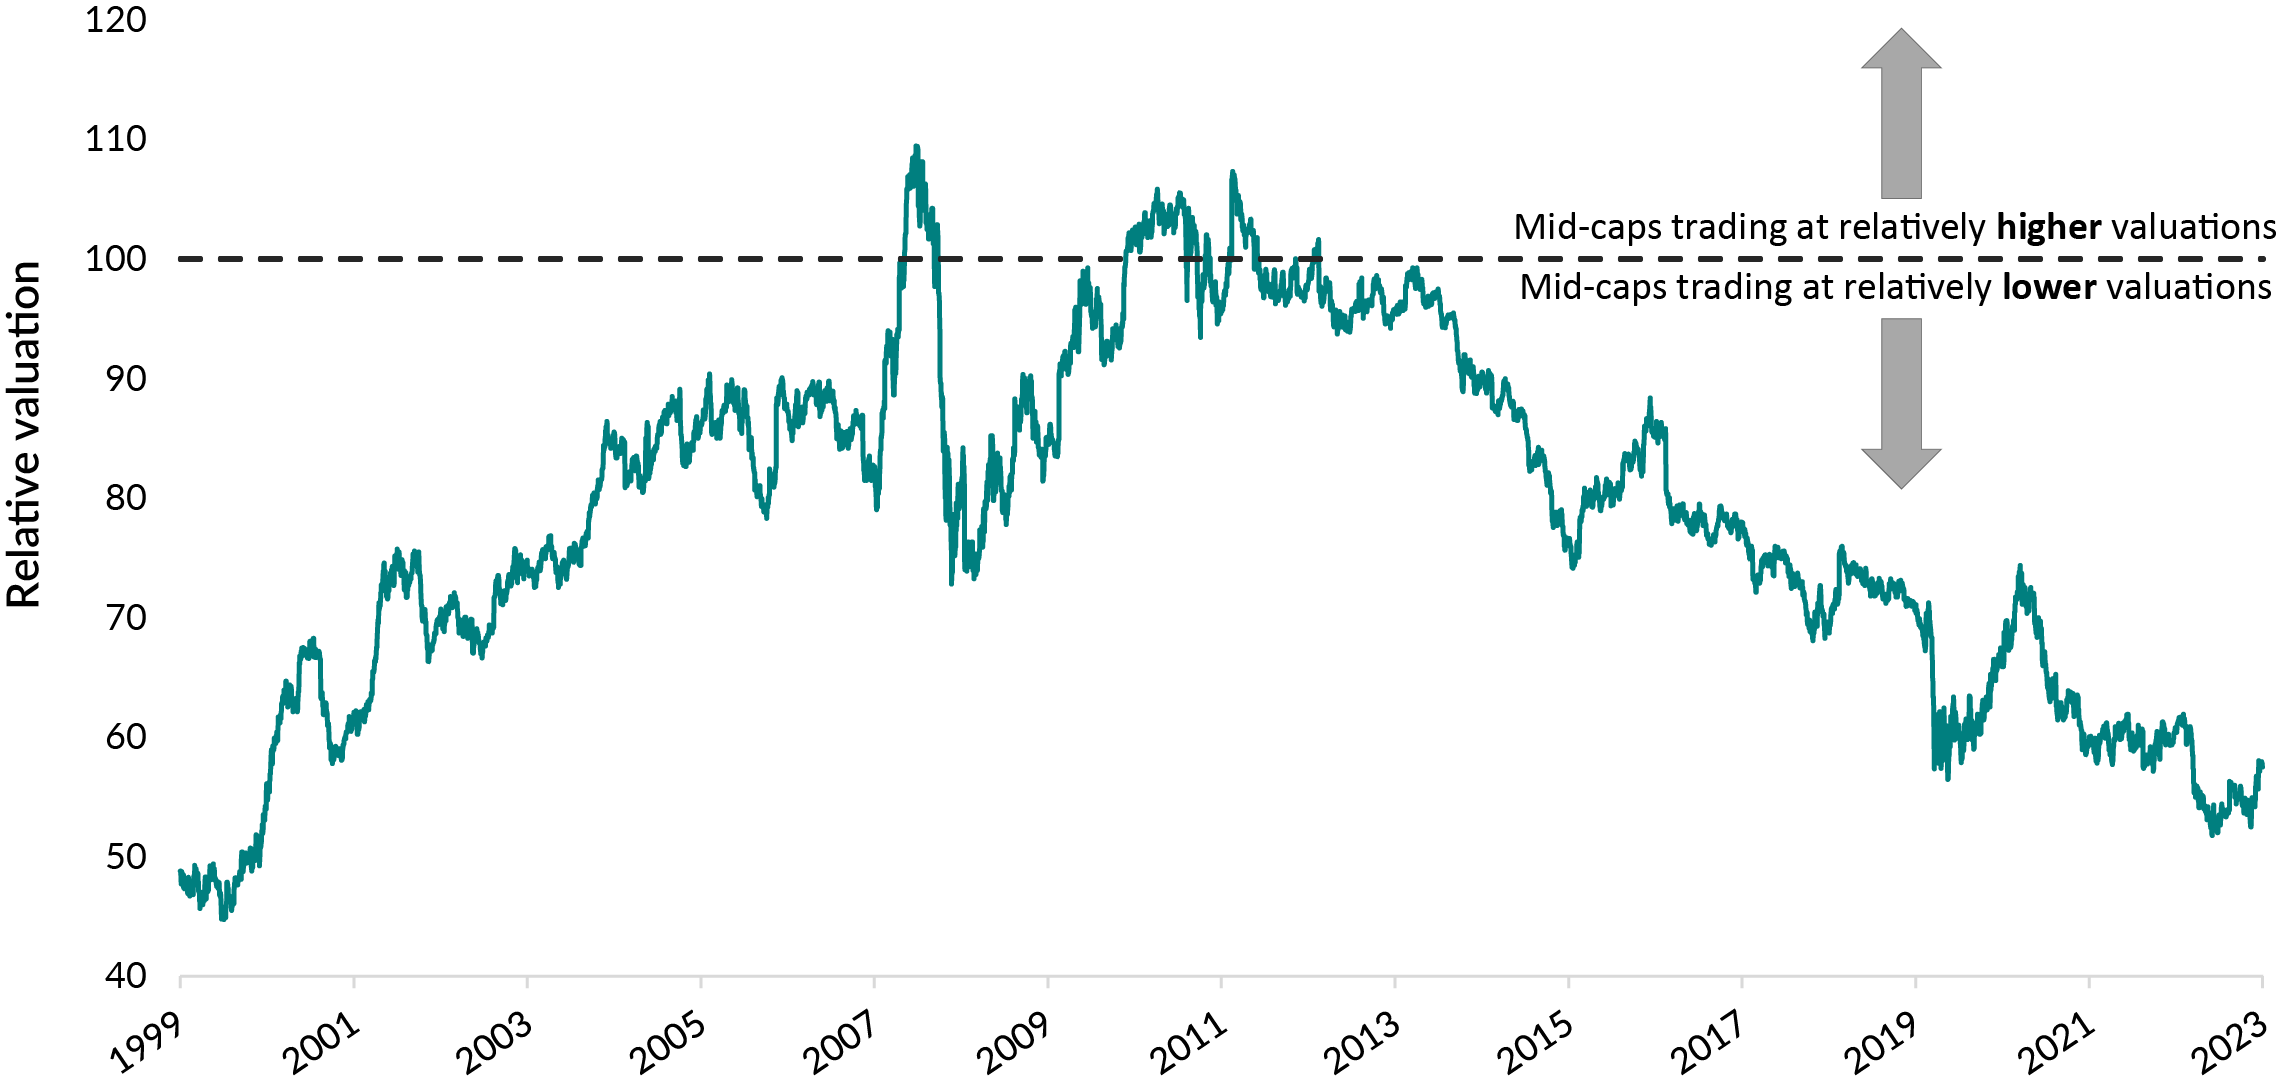
Source: FactSet Research Inc. The S&P 100 Index and S&P MidCap 400 Index are shown to compare the relative valuations of large- and medium-capitalization companies. The indexes are not investible. See Important information – benchmarks and indexes for additional details. Relative valuations are the daily average of five valuation metrics for the two indexes: price-to-earnings ratio, price-to-book value ratio, price-to-cash flow ratio, price-to-sales ratio and enterprise value-to-earnings before interest, taxes, depreciation and amortization.
In January of this year, we saw something that’s never happened before – the S&P 500 Index reached a new high while the small-cap Russell 2000 Index was in bear-market territory (i.e., down 20% from its peak). This is the clearest illustration of the growing levels of valuation distortion in today’s market.
S&P 500 Index vs. Russell 2000 Index – Growth of $100
Jan. 31, 2014 to Jan. 31, 2024
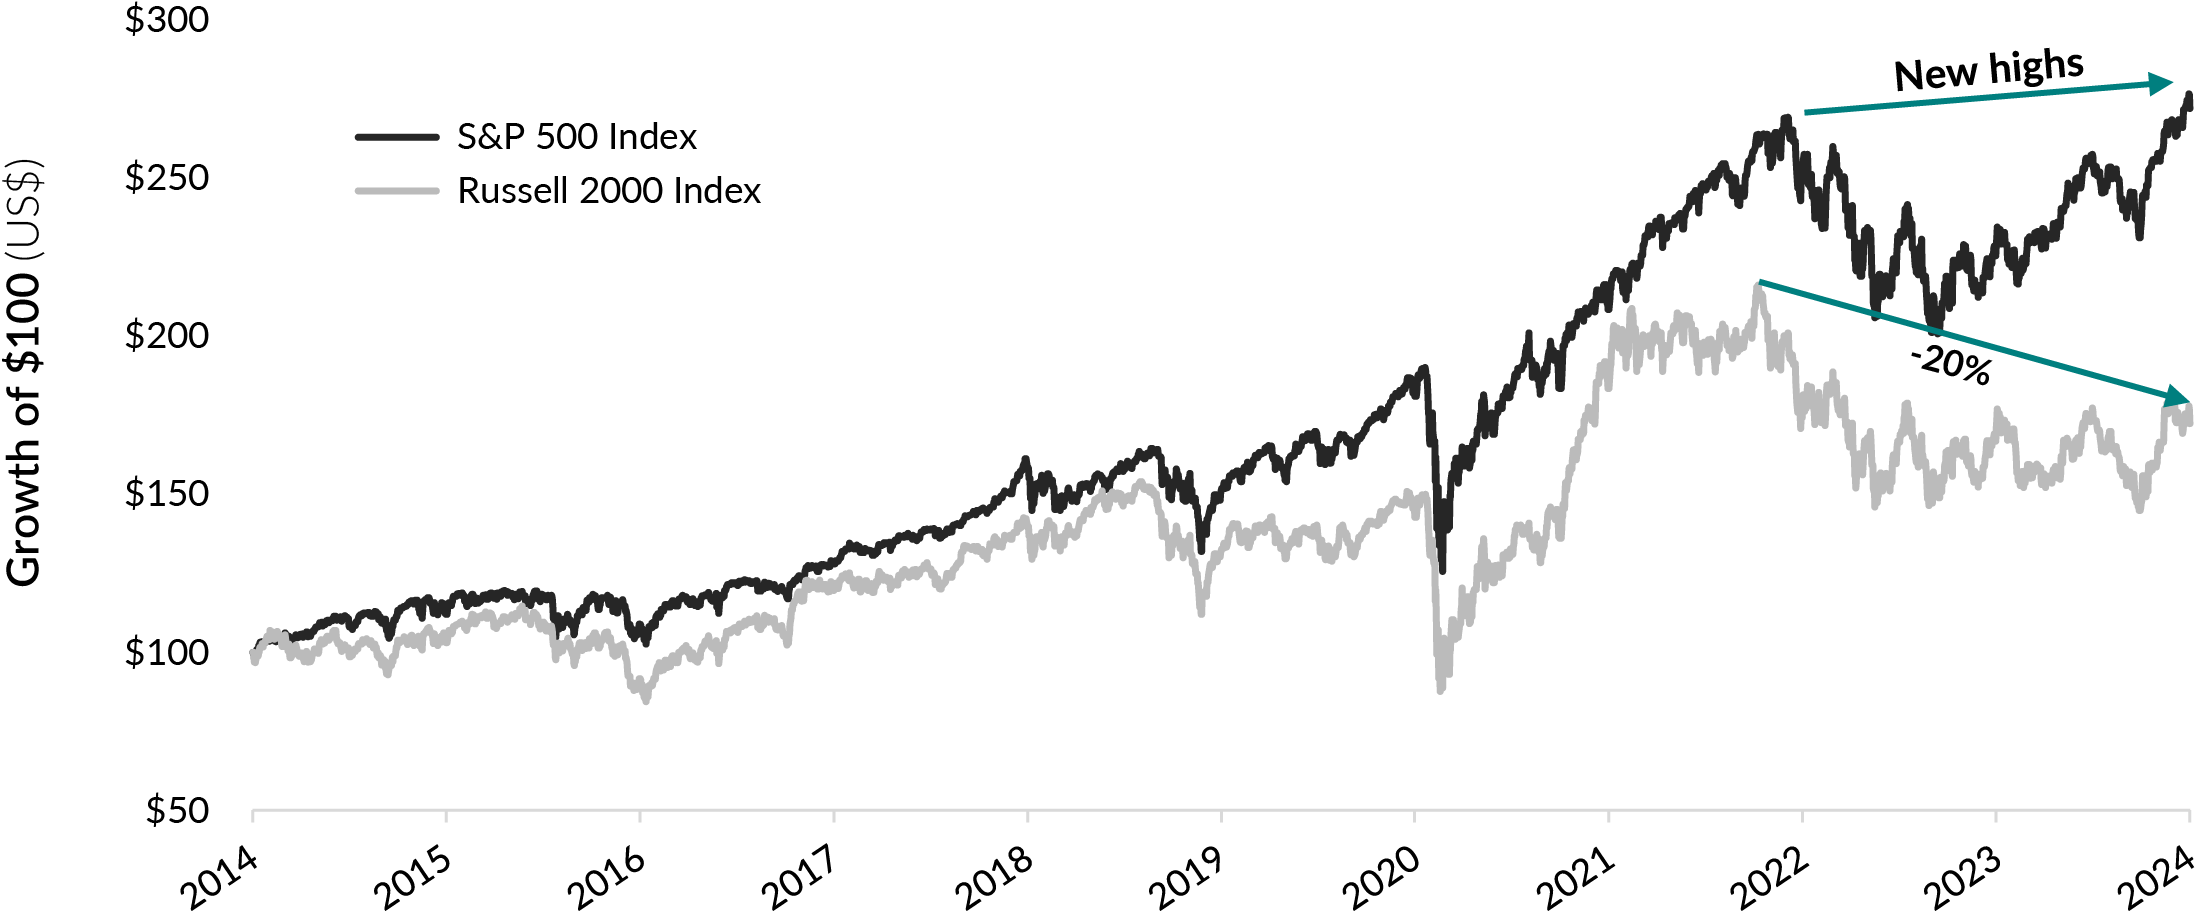
Source: FactSet Research Systems Inc. In US$. The S&P 500 Index and Russell 2000 Index are shown to compare return of large- and small-capitalization companies over a 10-year period. November 8, 2021 was the peak of the Russell 2000 Index. As of January 31, 2024, the price level of the Russell 2000 Index is 20% lower than its peak in November 2021, while the S&P 500 Index continues to reach new highs. The indexes are not investible. See Important information – benchmarks and indexes for additional details.
Our view is that looking beyond the mega-cap names may feel uncomfortable in the short term, but it has the potential to result in pleasing returns over the next five years. While other large Global Equity Funds are happy to invest in the consensus, we again happily find ourselves away from the crowd.
Number of global equity portfolios with top-10 holding overlap with Magnificent 7
36/41 Global Equity portfolios with top-10 holding overlap with the Magnificent 7
Source, competitor portfolios: Morningstar Direct. As at October 31, 2023. Global Equity portfolios includes funds in the Global Equity category with over C$1 billion in assets under management, for the total of 41 funds. Fund of funds and duplicated series are excluded. Morningstar classifies EdgePoint Global Portfolio within the Global Equity peer group. The Magnificent Seven securities consist of popular technology stocks Tesla Inc., Meta Platforms Inc., Nvidia Corp., Amazon.com Inc., Microsoft Corp., Alphabet Inc. and Apple Inc. These businesses were selected because of their significant index weighting. These businesses represent approximately 19% of the MSCI World Index as at October 30, 2023. The MSCI World Index was chosen as the benchmark for the EdgePoint Global Portfolio because it’s a widely used benchmark of the global equity market. Index is not investible. See Important information – benchmarks and indexes for additional details.The willingness to look wrong in the short term
Reaching your financial goals can be a lonely road and it’s tempting to follow others along a well-worn path because it seems like the safest option. Crowdsourced financial decisions are usually based on “common knowledge.” Although it may feel safe, unfortunately an idea's widespread acceptance practically guarantees its failure.
At EdgePoint, we firmly uphold the conviction that to outperform, you have to look different. Often, this means having the willingness to look wrong in the short term in order to be right in the long term.
Thank you for placing your trust in us. As always, we will work hard every day to continue earning it.
The indexes are not investible.We manage our Portfolios independently of the indexes we use as long-term performance comparisons. Differences including security holdings and geographic/sector allocations may impact comparability and could result in periods when our performance differs materially from the index. Additional factors such as yield, duration and credit quality may also impact comparability.
MSCI World Index (EdgePoint Global Portfolio benchmark) – A broad-based, market-capitalization-weighted index comprising equity securities available in developed markets globally. The index was chosen as the benchmark for the EdgePoint Global Portfolio because it’s a widely used benchmark of the global equity market.
S&P/TSX Composite Index (EdgePoint Canadian Portfolio benchmark) – a market-capitalization-weighted index comprising the largest and most widely held stocks traded on the Toronto Stock Exchange. The index was chosen as the benchmark for the EdgePoint Canadian Portfolio because it’s a widely used benchmark of the Canadian equity market.
ICE BofA Canada Broad Market Index (EdgePoint Global Growth & Income Portfolio and EdgePoint Canadian Growth & Income Portfolio fixed income benchmark) – An index that tracks the performance of investment-grade debt publicly issued in the Canadian domestic market. The index was chosen as the benchmark for the fixed income portion of the EdgePoint Growth & Income Portfolios because it’s a widely used benchmark of the Canadian fixed income market.
MSCI World Consumer Staples Sector Index – A market-capitalization-weighted indexes comprised of companies classified as Consumer Staples by the Global Industry Classification Standard.
MSCI World Utilities Sector Index – A market-capitalization-weighted indexes comprised of companies classified as Utilities by the Global Industry Classification Standard.
S&P 500 Index – a broad-based market-capitalization-weighted index of 500 of the largest and most widely held U.S. stocks.
MSCI EAFE Index – a broad-based, market-capitalization-weighted index comprising large- and mid-cap equity securities available in developed markets, excluding the U.S. and Canada.
Fama/French Total US Market Research Index – a value-weighted index of non-American depository receipt securities listed on the NYSE, AMEX or Nasdaq rebalanced monthly based on outstanding shares and prices from the current month and preceding one.
S&P 100 Index – an index composed of the 100 largest U.S. companies based on market capitalization.
S&P MidCap 400 Index – an index composed of the mid-range 400 U.S. companies based on market capitalization.
Russell 2000 Index – an index composed of approximately 2,000 U.S. small-capitalization companies.
Important information – definitions
Yield-to-maturity (yield) – the total return anticipated on a bond if it’s held until it matures and coupon payments are reinvested at the yield-to-maturity. Yield-to-maturity is expressed as an annual rate of return.
Duration – a measure of a debt instrument’s price sensitivity to a change in interest rates. The higher the duration, the more sensitive a bond’s price is to changes in interest rates.
i Source: Morningstar Direct. As at December 31, 2012. All funds within the Canadian Equity category, as classified by the Canadian Investment Funds Standards Committee (CIFSC), with a minimum of C$1 billion in assets under management were included. Canadian Equity funds invest predominantly in securities domiciled in Canada with an average market capitalization greater than the Canadian small/mid-cap threshold. These funds must invest at least 90% of equity holdings in Canadian domiciled securities.
ii See Important information – definitions for additional details.
iii See Important information – definitions for additional details.
iv Source: Bloomberg LP. Total returns annualized and in C$. As at January 31, 2024. The S&P/TSX Capped Energy Index is a 25% capped-weight index of GICS-classified energy companies that are part of the S&P/TSX Composite Index. The S&P/TSX Composite Index is a market-capitalization-weighted index comprising the largest and most widely held stocks traded on the Toronto Stock Exchange.