Where art thou, volatility? – 4th quarter, 2024
It’s been a while since we wrote a commentary proclaiming excitement for a flood of opportunities landing in our lap. Recent commentaries have focused on our stockpile of dry powder, the lack of discernment from lenders in the high-yield space, bloated balance sheets dominating indices or the precarious nature of risk.
Not ringing endorsements for piling headlong into credit.
We’ve also discussed how long these cycles can last, the difficulty of knowing when the party may end and the cost of trying to time the market…and being wrong. Our June 2023 commentary was a suggestion that investors stop obsessing over tight credit spreadsi or waiting to nail the bottom of the next market downturn. The high-yield marketii has since produced a total return of 15.0%,iii and our flagship opportunistic credit portfolio (not the actual name of the Portfolio, but you can read all about it here) has delivered decidedly better. It just doesn’t pay to sit on the sideline.
That’s not to say investors shouldn’t expect another market downturn – we will get a correction eventually. It’s not a matter of if, it’s a matter of when. It might happen tomorrow. We might be in one right now. It might happen 10 years from now. Nobody knows.
You’re invested in credit specifically for that future uncertainty. Your EdgePoint credit portfolios are built with the goal of protecting against – and benefiting from – the price dislocation brought on by the next market downturn. Even high-flying tech stocks and imaginary currencies make money in Lalaland markets. You own credit to earn a return when the funny-money charade starts trading like the deflating balloon that professes to support it.
If anything about 2024 was remarkable, it was just how remarkably dull it’s been investing in credit. There’s been no excitement at all, and if we can’t sit around waiting for the next calamity before making an investment, it would sure be nice to at least get some volatility. Recent client meetings have included the same questions: With so much uncertainty, how is it that credit markets are just so darn frothy? And how on earth do you plan to make money with things seemingly priced to perfection?
Private credit: panacea or pancake?
Well, when you have an asset class that grows from nothing to something close to US$2 trillion over the course of 20 years, it’s bound to have a spillover effect on neighbouring markets.
Private credit market size by region
2000 to 2023
Source: International Monetary Fund, The Last Mile: Financial Vulnerabilities and Risks. April 2024.
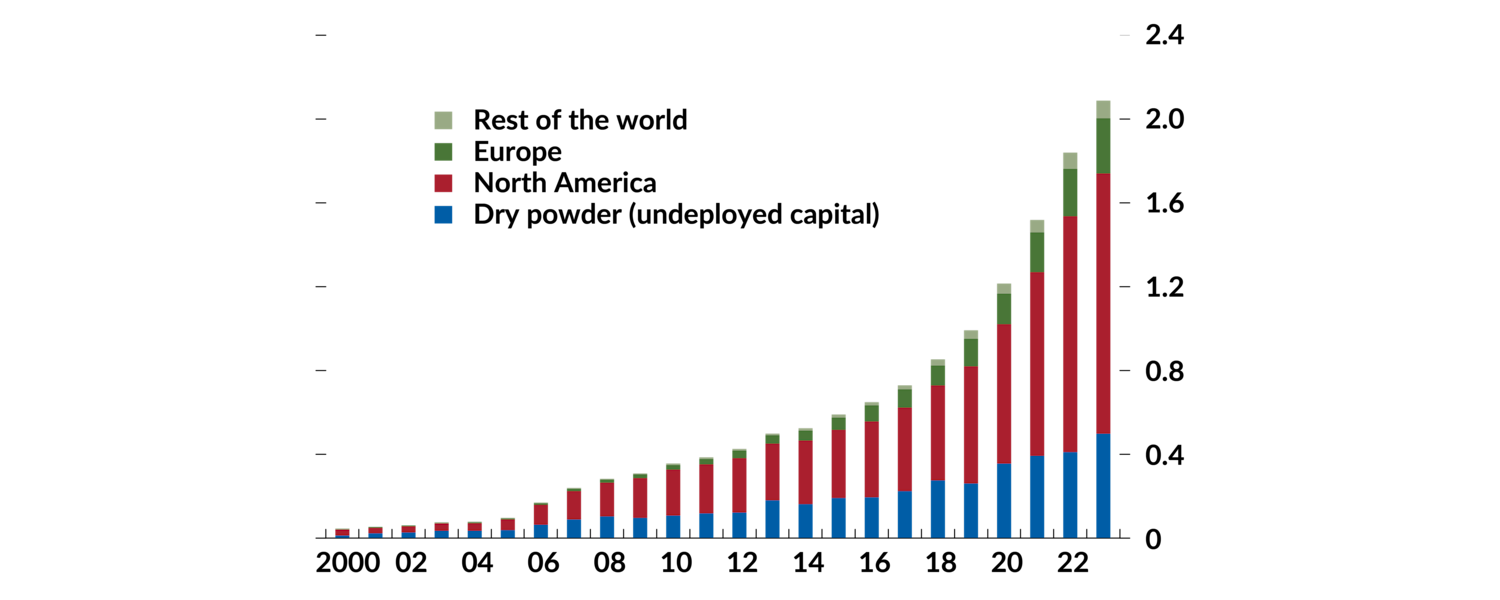
And the high-yield bond market today has one noisy neighbour (a real Ned Flanders). In recent years, the “private credit” market has grown from an irrelevant larva into a bloated blobfish. With a scale today on par with both the U.S. high-yield and publicly traded leveraged-loan markets, private credit can manoeuvre in corporate debt with the finesse of a bull in a Polly Pocket-sized china shop.
Private credit market size by type (US$T)
2001 to 2023
Source: International Monetary Fund, The Last Mile: Financial Vulnerabilities and Risks. April 2024.
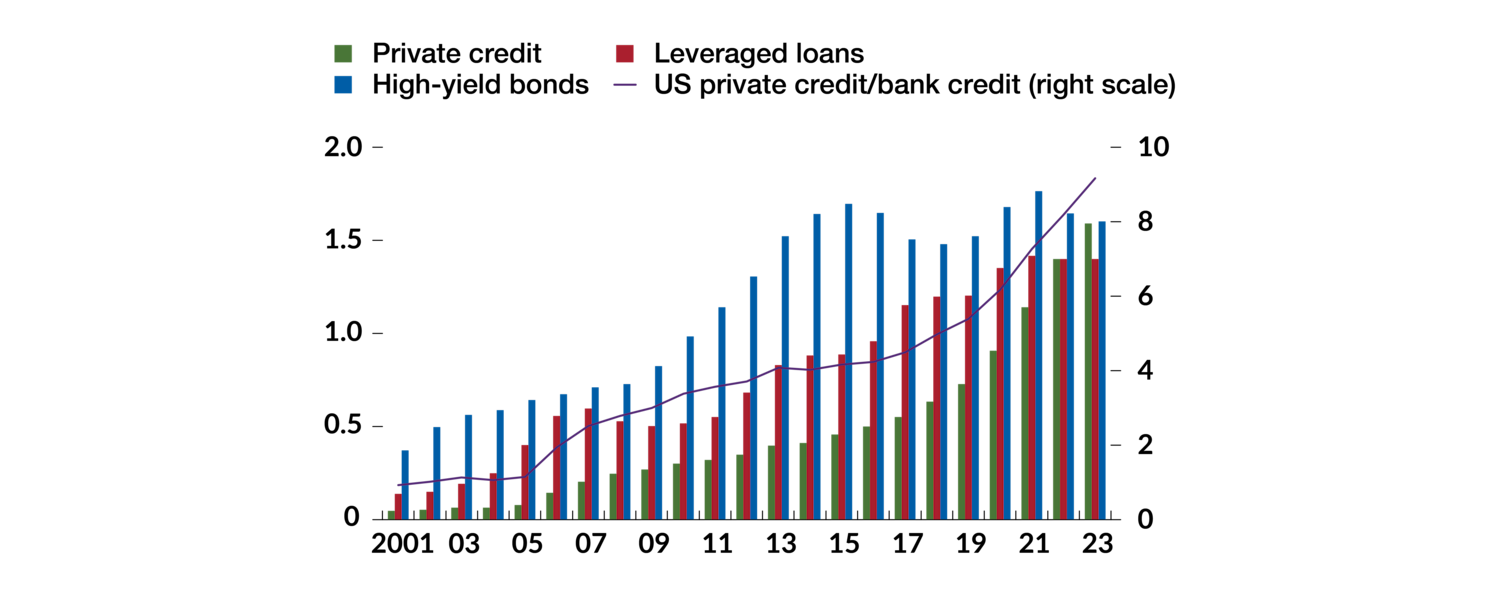
In just the past five years, private credit has grown by more than US$1 trillion. Trillion with a “T”, as in “Titanic” or “try putting that to work without stepping on a rake.” And then they needed a borrower! Marketing themselves as having vast research departments with armies of originations teams, private credit firms employ hundreds of bankers pretending to be investors (picturing Ned Flanders again). It’s all very sophisticated. To pay them all, private credit funds need very high fees. Very, very high fees.
Average total annual expenses
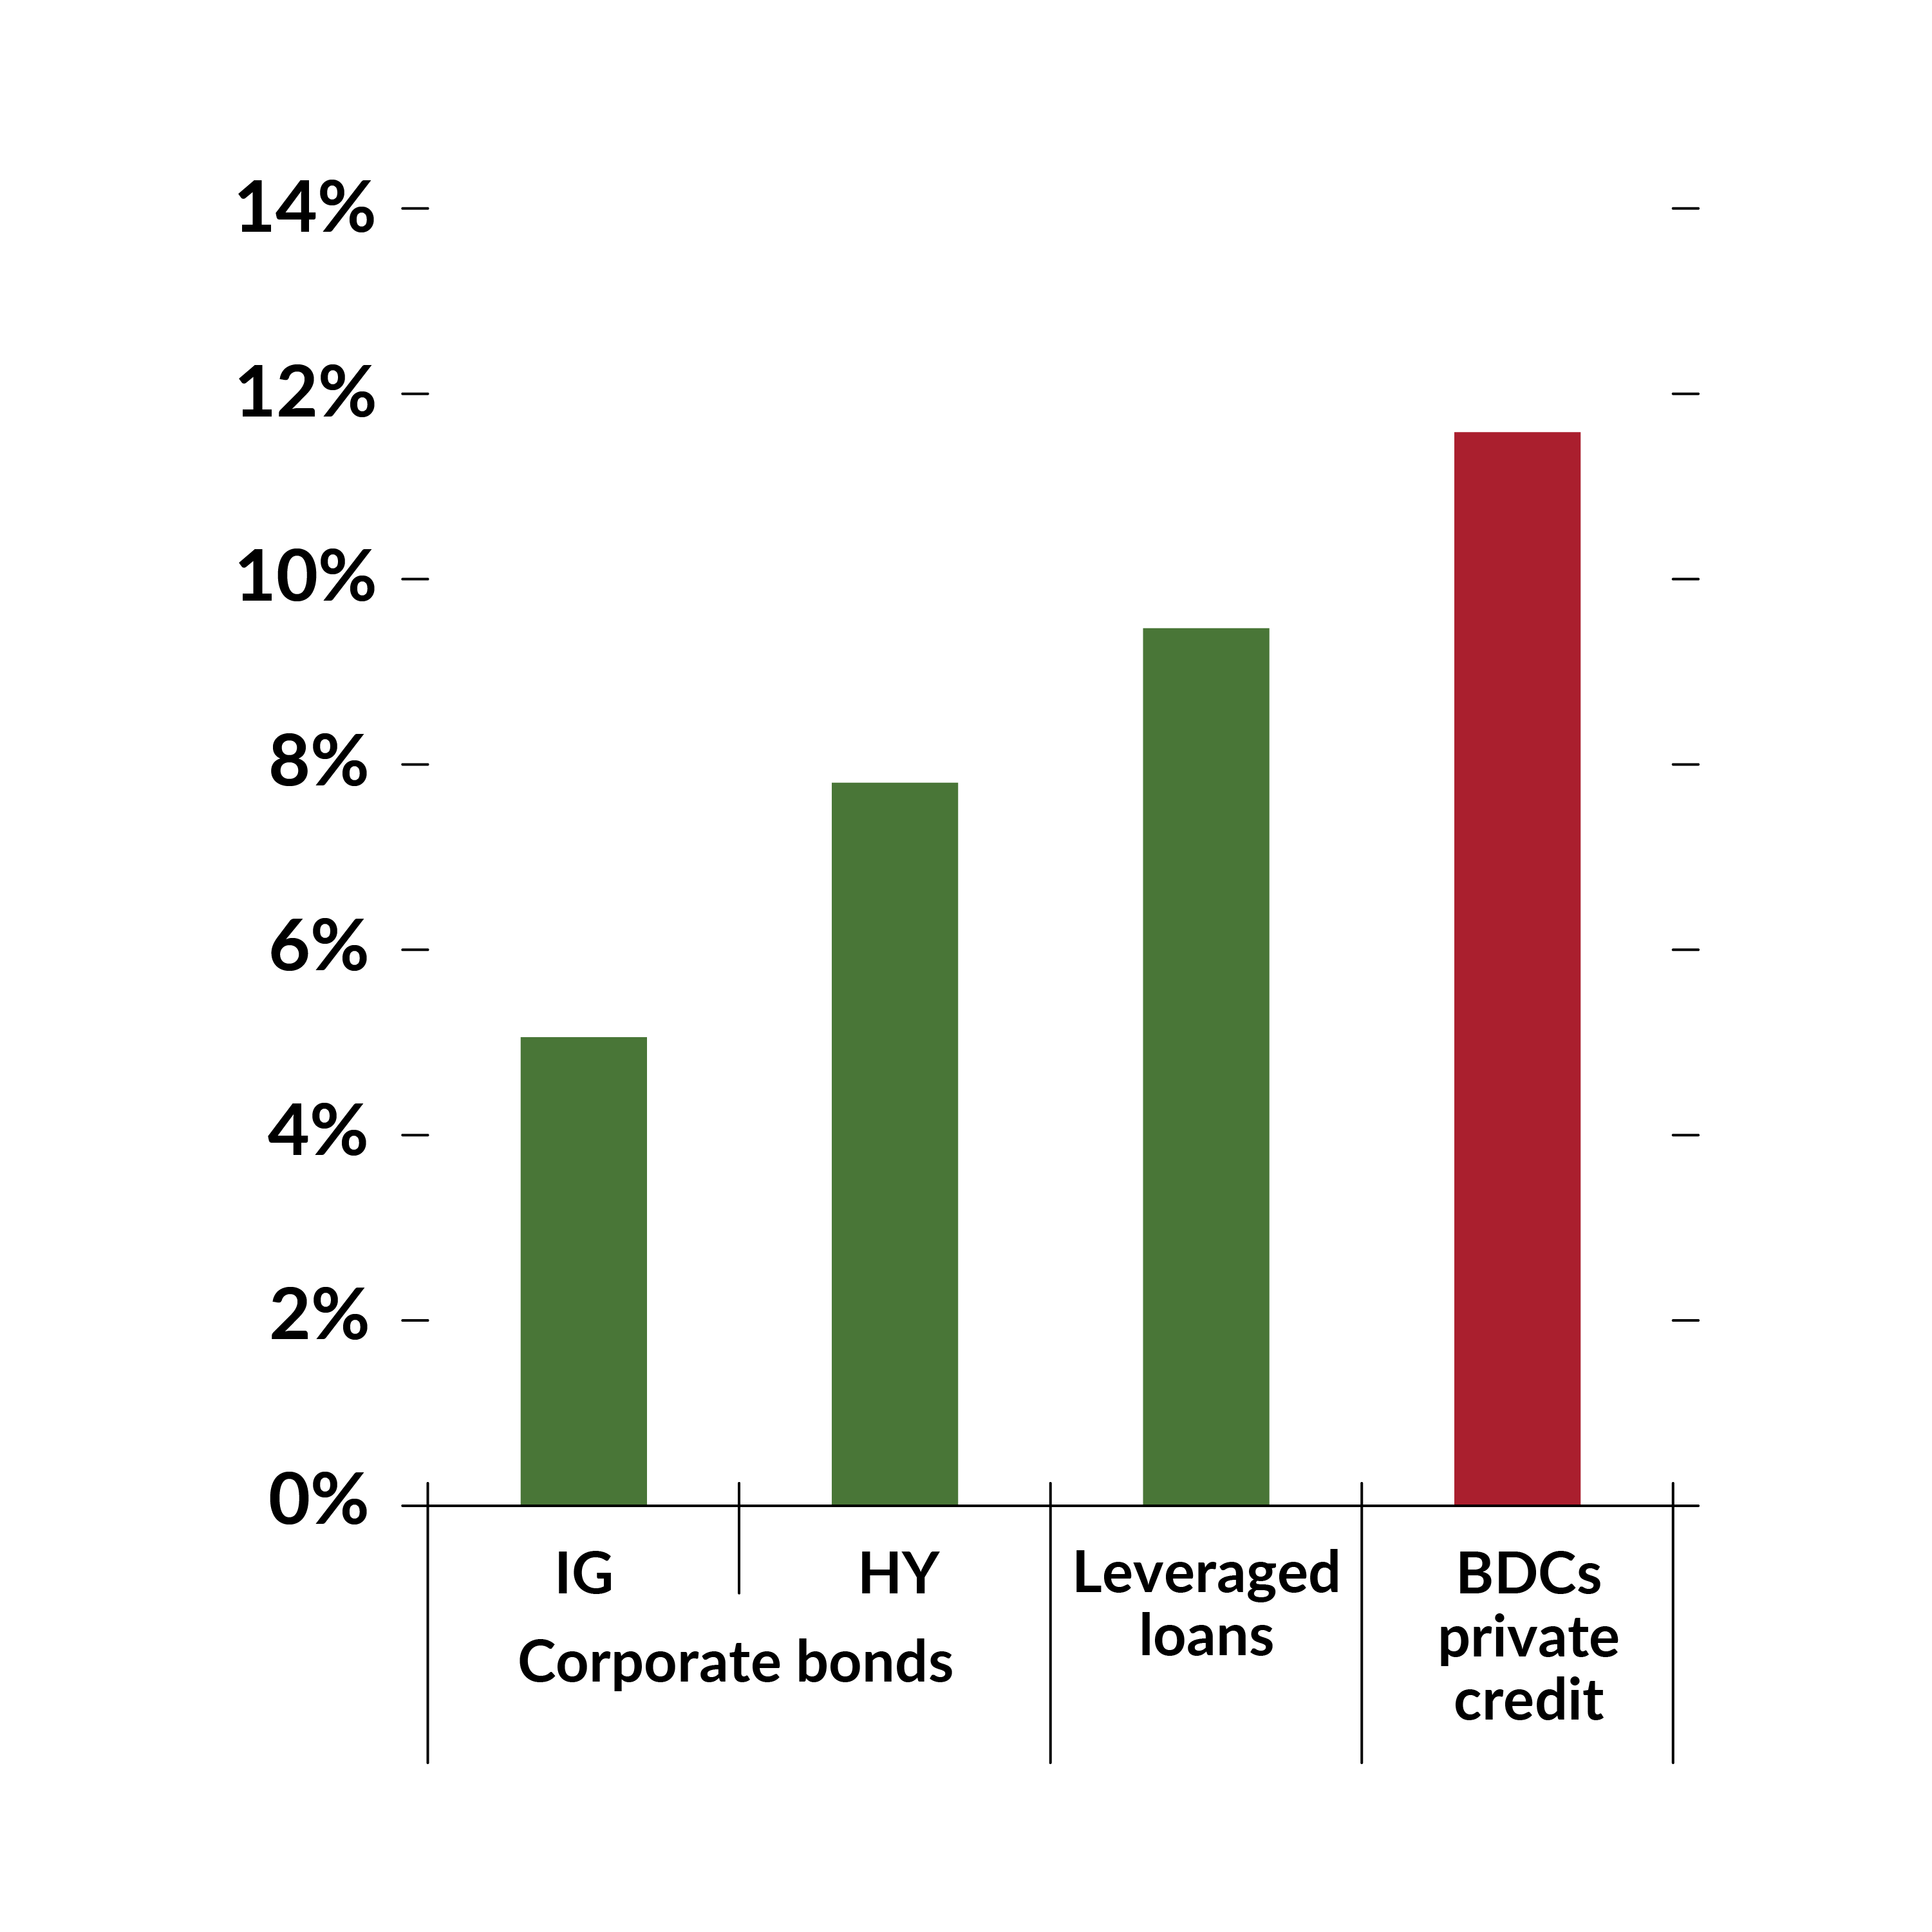
With total annual 2023 expenses on the average private credit portfolio at over 4% of net assets, the average private credit fund needs to lend at a rate at least that much higher than the high-yield market just to have a shot at keeping pace. So that’s what they do. The average yield on a private credit portfolio today is 12%, compared to 8% for the average high-yield bond.iv
Now ask yourself a question. Does it really make sense, any sense at all, that there were US$1 trillion worth of high-quality borrowers out there praying to borrow money at a 12% interest rate? The high-yield market is there willing to fund all kinds of crummy companies. The leveraged-loan market is fully available for even riskier companies. But no, US$1 trillion in borrowers sitting on the sideline waiting for that private credit saviour with financing available at a cool 12% rate??
The notion is absurd.
It’s a fundamental law of finance that individuals and businesses borrow at the lowest available rate. Anytime someone takes out a mortgage or car loan, or any time a business refinances its debt, the number one criterion in choosing a lender is that it’s the cheapest form of financing. Rue the day an EdgePoint portfolio company informs us that as much as the 8% offered by high yield was enticing, they couldn’t pass up the 12% available from private lenders. So, who’s borrowing all this money?!
U.S. corporate debt yields and median private credit loan rate (%)
Source: International Monetary Fund, The Last Mile: Financial Vulnerabilities and Risks. April 2024.
Banking on a scapegoat?
The refrain from private credit lenders is something along the lines of, “regulation has caused banks to pull back from lending, and our loans are replacing banks.” If this was true 20 years ago, it’s a joke today.
For starters, net-new regulation since 2019 has been sparse at best, certainly nothing that would cause banks to pull back to the tune of US$1 trillion. The average yield on a loan from JPMorgan – arguably the most heavily regulated bank on the planet – is about 7%, and its commercial loan book has grown by over 25% since 2019.v It wasn’t their loans.
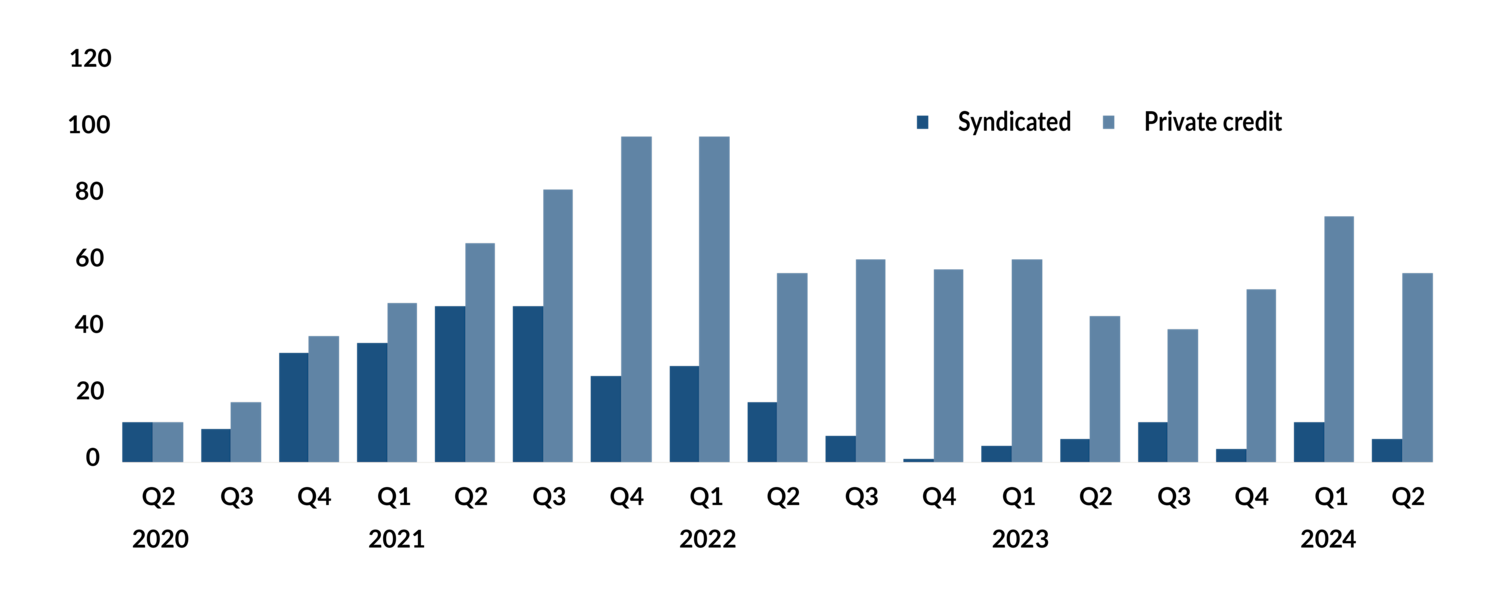
And we’re yet to find the bank loaded to the gills on loans to private-equity leveraged buyouts, which now make up 86% of all private credit portfolios. Since interest rates rose in 2022 and private equity became deer-in-the-headlights petrified at the reality of what it meant for over-levered businesses, private credit has effectively provided all new financing for what is otherwise the chumps’ end of the high-yield market.
U.S. leveraged buyouts in broadly syndicated loans and private credit markets
Apr. 2020 to Jun. 2024
Source: Pitch Book, Global Private Debt Report – H1 2024. Source, private credit: LCD News. As at June 18, 2024.
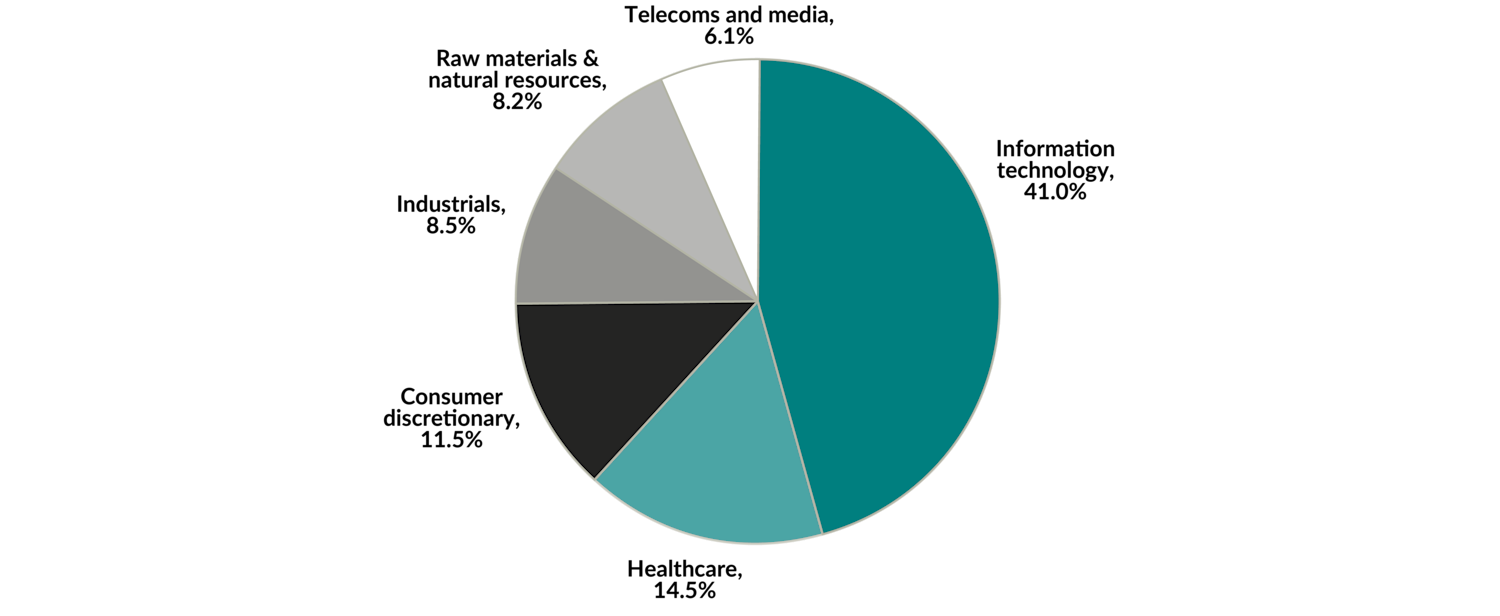
Banks were never big on lending to money-losing businesses (who would be?). With “information technology” (most certainly a euphemism for “profitless tech”) now making up 41% of all private credit assets, for the first time we will test whether “interest payment” and “no earnings” are more than an oxymoron. The healthcare and biotech "startups" responsible for another 15% of assets might be worse. If you find a private credit lender hawking “loan-to-value” as a good measure of creditworthiness, run. The value is likely inflated and it probably means there are no profits.
Private credit sector allocation – % of global 3-year deal volume
Source: International Monetary Fund, The Last Mile: Financial Vulnerabilities and Risks. April 2024.
We know of no banks willing to fund with paid-in-kind interest (where rather than actual cash, borrowers “pay” interest by adding to a pile of IOUs), lend at 4.5x leverage using borrower-defined measures of profitability, or provide new debt so the borrower has the cash to pay interest on existing loans.vi Which brings us to the ridiculous claim that credit losses have been low. Because if you make a loan and ignore deteriorating profitability, never ask for the money back and lend money as new debt to pay existing interest, it’s a fact that you won’t record any credit losses. It is equally a fact that you are running a Ponzi scheme.
So no, these loans didn’t come from banks. It’s our view that the overwhelming majority of recent private credit loans were either sourced directly out of the riskiest end of publicly traded credit markets, or went to fund companies that public markets declined to fund altogether. Trying to build a portfolio by lending to the businesses with the worst balance sheets doesn’t sound like the world’s most brilliant investment idea, but why quibble? It’s not my money.
This wasn’t meant to be a dig at private credit (but why pass up the opportunity). The point is that if private credit isn’t replacing banks but rather taking the riskiest deals out of public markets, then it makes all the sense in the world that the high-yield index has been more resilient than prior cycles. US$1 trillion is a lot of new capital chasing the hairiest deals. From leverage ratios to credit ratings, standard measures of risk suggest the high-yield index today is of a higher quality than it’s been for the better part of the past decade.
U.S. high-yield and private leveraged loan net leverage
2016 to 2023
Source: Credit Sights, U.S. Special Situations: 2025 Outlook & 2024 Review. December 2024. Private loans uses adjusted EBITDA.
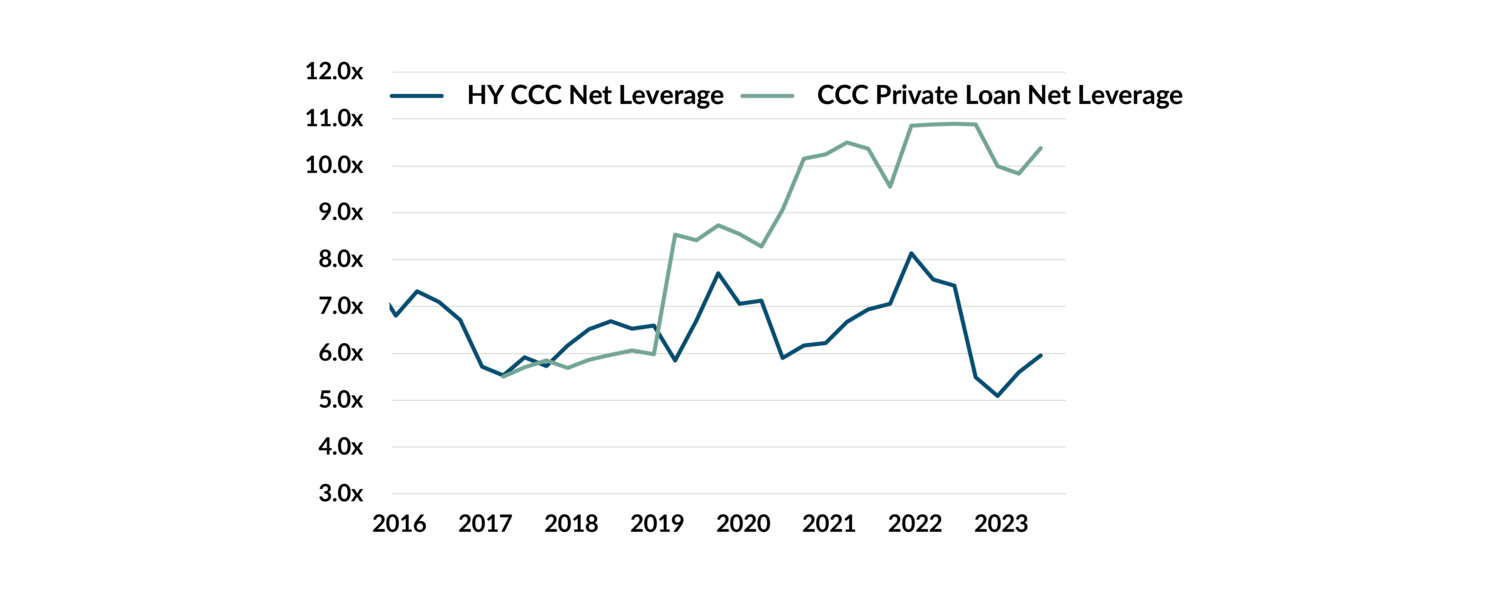
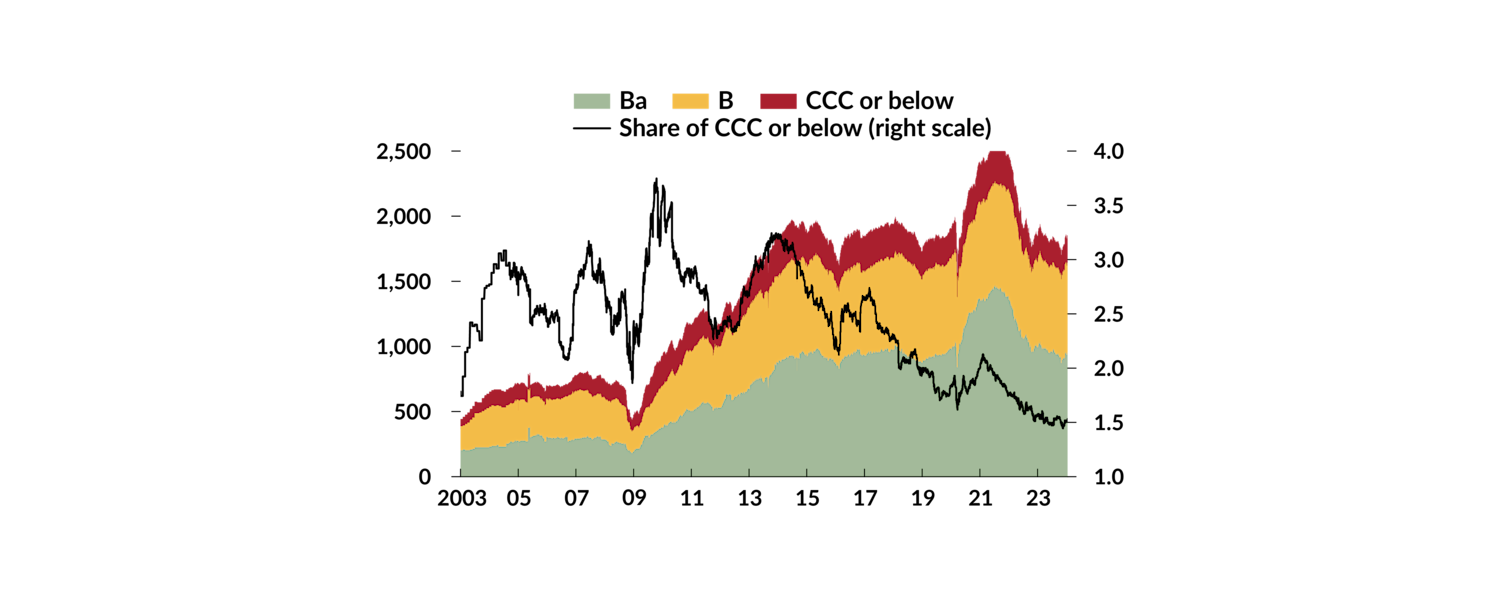
The best evidence is below: CCC-rated bonds (those with the lowest credit rating according to agencies) have been disappearing from public credit markets altogether.
Distribution of global corporate bond market by rating (US$B)
2003 to 2023
Source: International Monetary Fund, The Last Mile: Financial Vulnerabilities and Risks. April 2024.
Avoiding things that trade doesn’t make you a genius
Of course, yes, there are competent managers operating in private credit, and there’s nothing inherently wrong with a loan just because it’s private. There are advantages to working directly with management teams in structuring, pricing, and negotiating terms. Credit ratings are probably more noise than value-add, roadshows add unnecessary cost and waiting as other bond managers dawdle over minutia can make us wish we were doing some deals ourselves. We have been the sole lender on a few bonds in the past, and we may do more in the future. These deals are few and far between.
The yahoos who discovered that they could lend money, record interest income and never acknowledge a loss didn’t find a secret universe of borrowers at double-digit yields. In aggregate, it’s impossible to imagine that the US$1 trillion in private credit assets put to work since 2019 isn’t loaded with landmines.
And yes, lending at above-average rates is exactly what we’re trying to do. But we don’t just lend to the highest-yielding thing we can find – that wouldn’t make sense. Selecting each investment in our credit portfolios involves careful study of each business’ future prospects. Importantly, we’re looking for a unique insight as to why there will be a change in the business, i.e., why it will be more profitable in the future than it was in the past. It’s this unique view that offers the potential for outsized return. Willy nilly spraying US$1 trillion all over creation seems like an exercise in unwarranted optimism.
The existing universe of U.S. and Canadian high-yield bonds, loans and convertible debt includes more than 4,400 investments that we have to choose from.
Approximate number of bonds by type
As at Dec. 31, 2024

Sources: FactSet Research Systems Inc., Bloomberg LP, BMO Global Asset Management Inc, JP Morgan Chase & Co., BlackRock, Inc. As at December 31, 2024. See Important information – index definitions for additional information. The indexes are not investible.
We’re trying to build a collection of 45 to 50 of them for the high-yield portion of our Portfolios. In evaluating a new bond where we have insight, we compare the yield available to the businesses we already own. If the new bond adds to our potential return or reduces our risk, we buy. Today, the high-yield portion of the EdgePoint Growth & Income Portfolios yields around 8%,vii* and accounts for a quarter of the Portfolios’ fixed-income weight. Do we wish it was higher? Sure. Every day we look to improve on it. (Imagine if we had a Portfolio made up almost entirely of these securities...)
*Portfolio performance as at September 30, 2025. Annualized total returns, net of fees (excluding advisory fees), in C$.
EdgePoint Global Growth & Income Portfolio, Series F: YTD 9.99%; 1-year: 10.95%; 3-year: 13.64%; 5-year: 10.49%; 10-year: 8.30%; 15-year: 10.40%; Since inception (Nov. 17, 2008): 11.35%. EdgePoint Canadian Growth & Income Portfolio, Series F: YTD: 13.45%; 1-year: 17.19%; 3-year: 18.36%; 5-year: 17.66%; 10-year: 10.80%; 15-year: 10.12%; Since inception (Nov. 17, 2008): 11.90%.
Series F is available to investors in a fee-based/advisory fee arrangement and doesn’t require EdgePoint to incur distribution costs in the form of trailing commissions to dealers.
Maybe the most ridiculous aspect of private credit is the universe of investments it explicitly ignores. From the perspective of a private lender, publicly traded bond and loan markets don’t exist. While each “private credit” deal is absolutely a candidate for our Portfolios (even if we had any interest in lending money to a private credit borrower at a reasonable rate, they would take it), the very fact that existing high-yield bonds and loans trade on public markets precludes them from private credit portfolios. Imagine the horror of having to mark a position to market.
We’ll let you in on a little secret: it’s an absolute gift that the overwhelming majority of bonds trade on a daily basis. If you have any skill at all as an analyst on a portfolio, it can only possibly be a net benefit that investments fluctuate in price.
Looking Forward
Forward Air Corp. was a top contributor to your EdgePoint credit portfolios in 2024.viii The business operates as a “less-than-truckload” or “LTL” shipping company across the United States. The company provides trucking services for customers looking to ship goods in quantities insufficient to fill an entire truck. LTL trucking continues to grow as shippers improve supply chain efficiency, just-in-time inventory gains in popularity and e-commerce takes share from brick-&-mortar retail. It’s also much less competitive than traditional trucking as shipments run through a “network” rather than straight linehaul.
Presumably frustrated that Forward Air was built as a wholesale shipper working for other logistics providers rather than directly with end-customers, management had the bright idea in summer 2023 of acquiring a customer for close to US$3 billion – equivalent to Forward’s entire market cap at the time. Beyond the fact that they massively, massively overpaid, this also had the potential to frustrate a lot of other customers just as the company was enduring the deepest freight recession in 15 years. Still, with strong industry tailwinds and an irreplaceable network, this seeming disaster screamed opportunity.
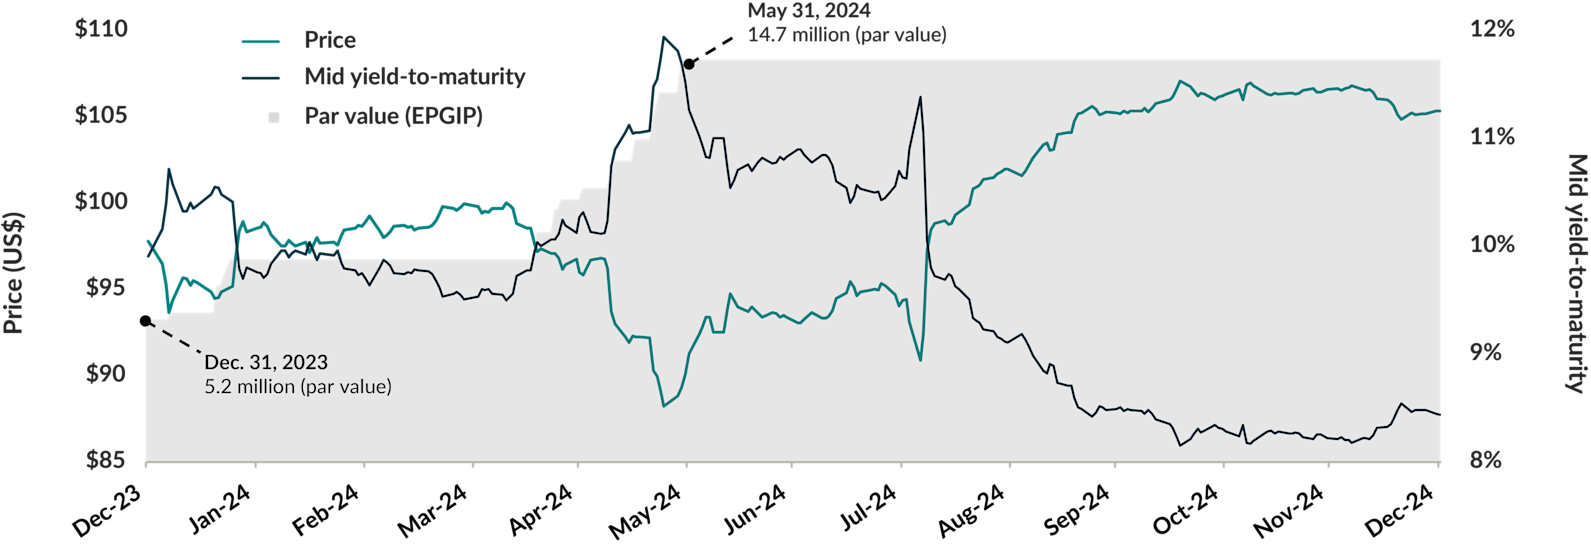
We made an initial purchase of Forward Air bonds in late 2023 in each of the EdgePoint Growth & Income Portfolios at a 10% yield. As frustrated shareholders tried to undo the transaction, management was replaced and the freight recession deepened, the bonds fell to a low of US$88 in the spring of 2024, offering a yield-to-maturity of 12%. Seeing none of this as having an impact on long-term business prospects, we tripled our weights and turned an attractive total return into a 25% internal rate of return.ix Now, if we found today’s yield of 8% unattractive, we could sell and move on to other opportunities.
Forward Air Corp., 9.5%, due 2031/10/15 – price vs. mid yield-to-maturity vs. EdgePoint ownership in EdgePoint Global Growth & Income Portfolio (EPGIP)
Dec. 31, 2023 to Dec. 31, 2024
Portfolio performance as at September 30, 2025. Annualized total returns, net of fees (excluding advisory fees), in C$.
EdgePoint Global Growth & Income Portfolio, Series F: YTD 9.99%; 1-year: 10.95%; 3-year: 13.64%; 5-year: 10.49%; 10-year: 8.30%; 15-year: 10.40%; Since inception (Nov. 17, 2008): 11.35%. EdgePoint Canadian Growth & Income Portfolio, Series F: YTD: 13.45%; 1-year: 17.19%; 3-year: 18.36%; 5-year: 17.66%; 10-year: 10.80%; 15-year: 10.12%; Since inception (Nov. 17, 2008): 11.90%.
Series F is available to investors in a fee-based/advisory fee arrangement and doesn’t require EdgePoint to incur distribution costs in the form of trailing commissions to dealers.
Source: Bloomberg LP. Mid yield-to-maturity is bond’s yield-to-maturity based on the mid-point between the security’s lowest asking price (sell) and highest offering price (buy) available on public markets. Yield-to-maturity is the total return anticipated on a bond if it’s held until it matures and coupon payments are reinvested at the yield-to-maturity. Yield-to-maturity is expressed as an annual rate of return. As at December 31, 2024, Forward Air Corp. securities were held in EdgePoint Global Growth & Income Portfolio, EdgePoint Canadian Growth & Income Portfolio and EdgePoint Monthly Income Portfolio. Information on the above company’s securities is not intended as investment advice. They are not representative of the entire portfolio, nor is it a guarantee of future performance. EdgePoint Investment Group Inc. may be buying or selling positions in the above securities. Past performance is no guarantee of future results.
In what world are we better off if these bonds don’t trade? With the inability to capitalize on market mispricing, the potential return from private credit can only possibly be worse than public markets.
“Risk tends to migrate to the hands least capable of managing it.” - Alex J. Pollock
If you haven’t noticed, we don’t understand why investors are so gung-ho about private credit. Promoters didn’t discover a trillion-dollar universe of wonderful companies that need money at the highest possible rates. The results are misleading, the volatility is understated and elephant-sized risks exist in what’s masquerading as a benign market. There’s a reason the entire history of finance has been a progression toward making it easier to buy and sell individual assets. Taking an asset that used to trade, and now making it not trade, is wholly counterproductive if the intent is anything other than to deceive.
Growth in private credit has had an impact on public markets. The riskiest borrowers have a new pool of capital competing with high yield in the new-issue market. But there’s an entire world of publicly traded investments ignored by money desperate to remain “private.” Headline “credit spreads” don’t tell the story of opportunity beneath the surface. And it only gets better. Because one day the elephant-sized risks will lay an elephant-sized egg. We don’t even need a credit cycle – we just need someone to ask for their money back. We believe there will be massive opportunities for managers looking to pick up the pieces on the other side.