Dare to be different – 3rd quarter, 2025
Enjoyed what you read below and want to hear directly from the author? Jeff and relationship manager Sarah Ford discuss the commentary, expanding on topics and covering some things that couldn't make it into the piece!
Recently I read an interesting book called Engines that Move Markets by Alasdair Nairn. It explores how major technological innovations over the last 200 years have influenced both the economy and financial markets. History tends to repeat itself in financial markets as memories are short:
A transformative technology emerges
Investors become euphoric and a bubble begins to form
New competition enters the market, funded by excess capital
The new industry becomes oversupplied, causing profits, margins and returns on capital to deteriorate
A period of consolidation follows, where weaker competitors exit through losses and bankruptcy.
The authors note that in the middle of the rise, it’s very difficult to identify the ultimate winners but it’s often easier to spot the likely losers.
Looking in the rearview mirror
People take cars for granted today, but there were a few bumps in the road before they became common. For example, when Henry Ford launched the Model T in 1908, there were already 253 active automobile manufacturers in the U.S. An investor at the time couldn’t have known which companies would survive, but as the cliché goes, it marked the beginning of the end for horse whips. In 1900, the U.S. had just 8,000 automobiles compared to 21 million horses. Fifty years later the numbers had reversed – 40 million cars versus seven million horses.
Despite booming sales, brutal competition consolidated the industry to only 10 companies by the 1930s and eventually whittled it down to the Big Three. Yet survival didn’t guarantee shareholder success as both GM and Chrysler went bankrupt during the 2008-09 Financial Crisis. Ford survived, but its investors fared poorly – from a split-adjusted IPO price of US$1.64 in 1956 to about US$11.96 today (or roughly a 3% compound annual return over 70 years, excluding dividends).i
It might be easy to blame the decline of internal-combustion engine car companies on another disruptor: electric vehicles (EVs). The truth is that they aren’t new. In the early 1900s, a third of all cars in the U.S. were electric, with the rest split between gas and steam. What doomed battery-powered cars back then was high cost, limited range and lack of charging infrastructure – ironically, many of the same challenges that EVs face today. While today’s EV winners aren’t obvious yet, many investors have put their money into Tesla. Despite being the most famous EV company, Tesla doesn’t sell the most EVs annually and more competitors have been continuing to take market share. That doesn’t seem like a formula for an obvious winner.
What a difference a year doesn’t make
Another innovation that today’s investors are excited about is artificial intelligence (A.I.), specialized software and hardware that enables computers to perform tasks normally requiring human intelligence. A simple example is using ChatGPT to gather data and answer questions. This enthusiasm has fueled a new bubble in large U.S. technology companies, often referred to as the “Mag 6” – Alphabet (Google), Amazon, Apple, Meta (Facebook), Microsoft and NVIDIA.
The herd mentality is evident. Last year, I highlighted how many global funds were blatantly copying the index to reduce tracking error (i.e., minimizing the risk of underperforming a benchmark by mimicking it). One striking example was a firm that ran four U.S. equity funds – value, growth, dividend and core. Despite the different fund names, the Mag 6 were the six largest holdings for all four funds and in the MSCI World Index.
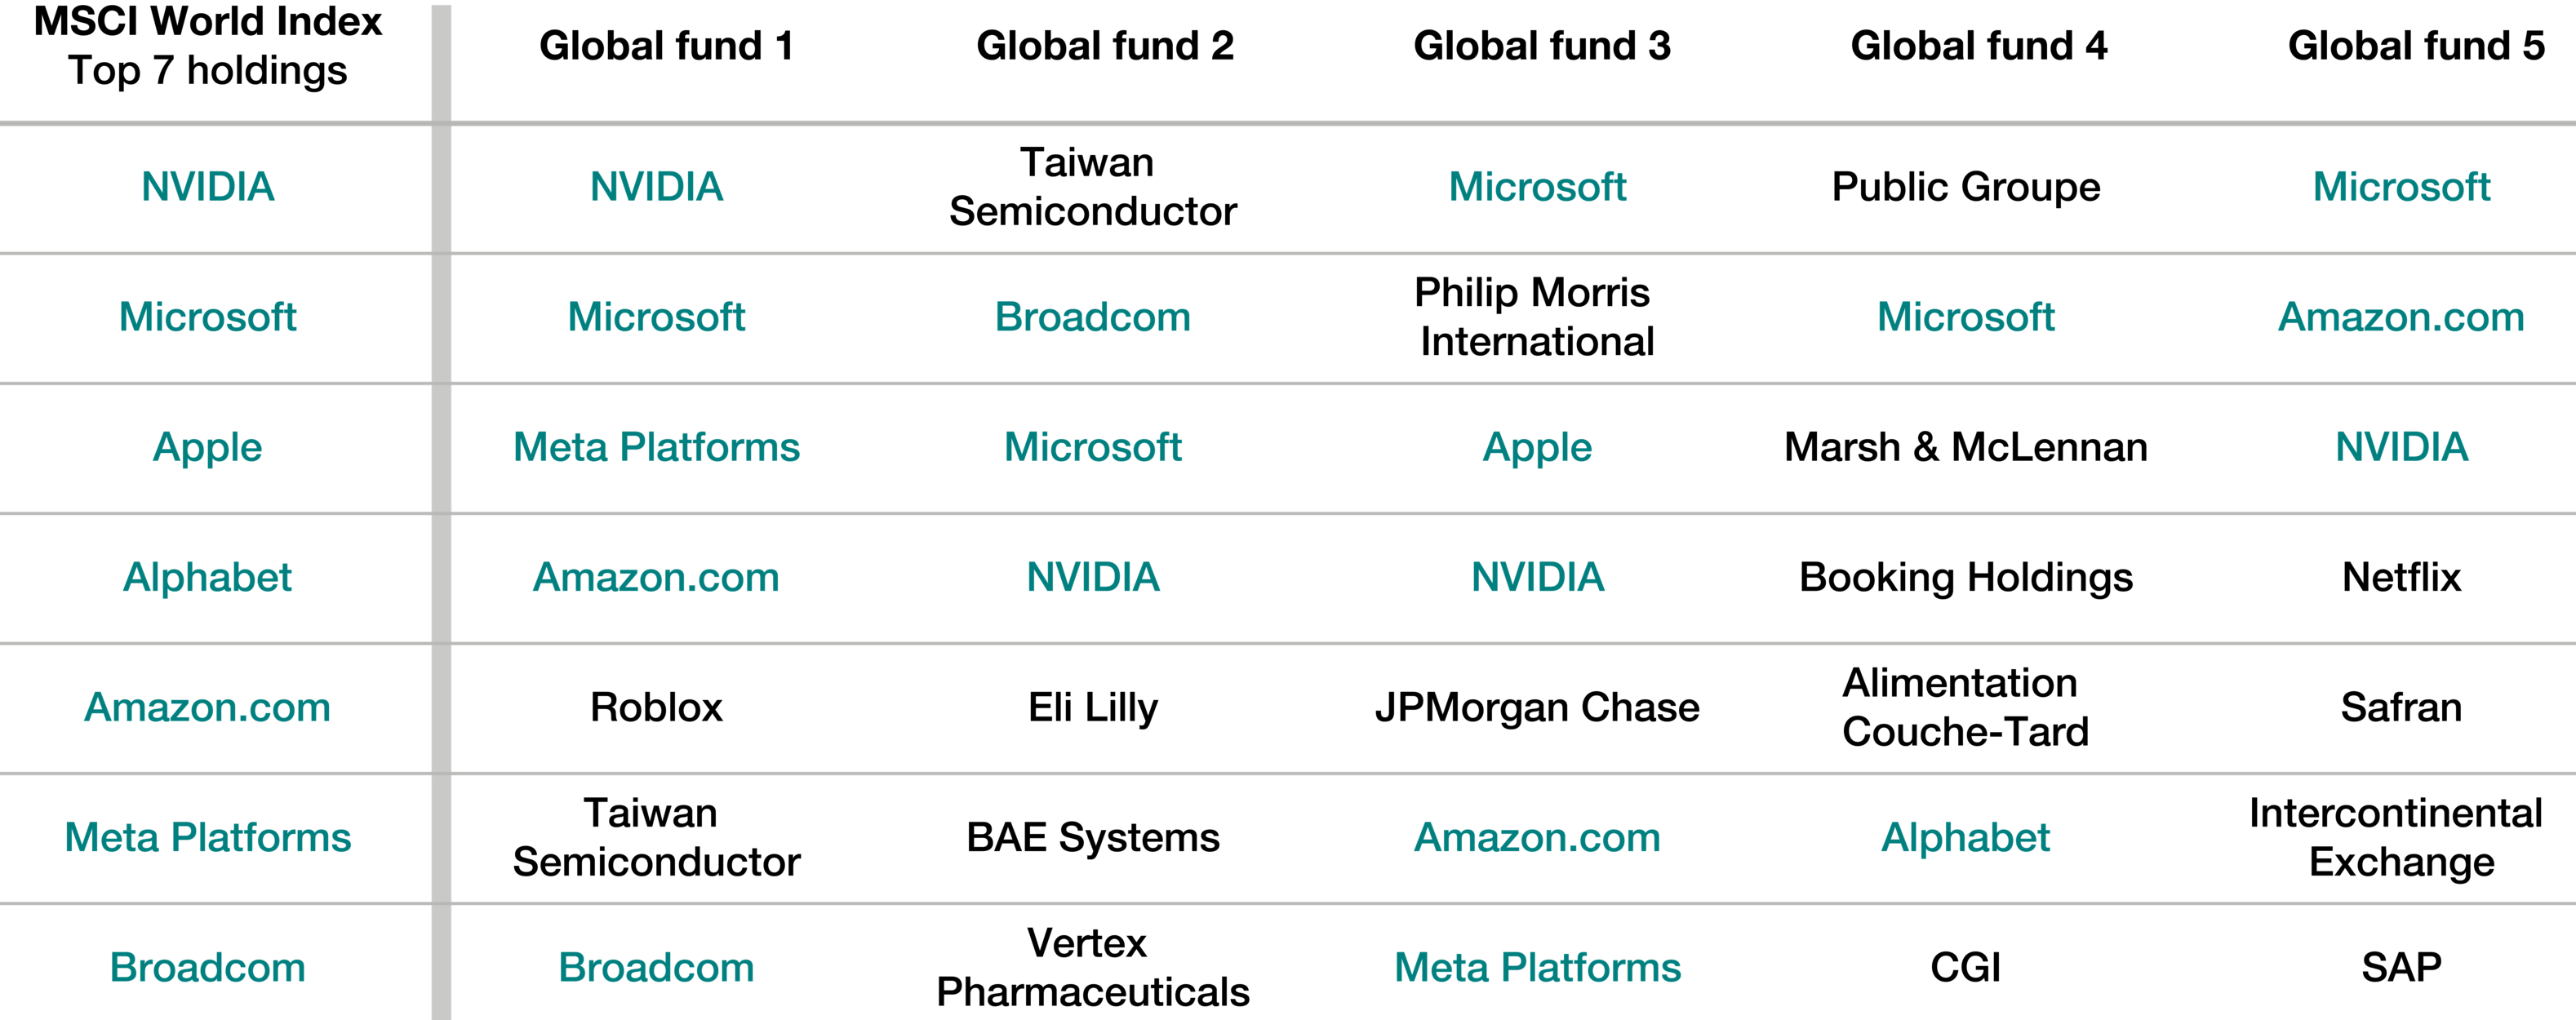
A year later, the Mag 6 is still at the top of the index along with semiconductor company Broadcom. How do our five largest peers in the Global Equity category compare?
Five largest Global Equity peers vs. the Mag 6 & Broadcom – top-seven holdings
As at Aug. 31, 2025
Source: FactSet Research Systems Inc. As at August 31, 2025. The above example is for illustrative purposes only and not intended as investment advice. These funds were selected because they are the five largest funds by AUM within the Global Equity category by Morningstar, excluding EdgePoint Global Portfolio which does not hold any of the MSCI World Index top-seven holdings. Morningstar classifies EdgePoint Global Portfolio within the Global Equity peer group, which are open-end mutual funds that invest in securities domiciled anywhere around the world with an average market capitalization greater than the small/mid-cap level. These funds must invest between 10% and 90% of equity holdings in Canadian or U.S. companies. Funds without strict investment restrictions and don’t qualify for other geographic categories are assigned to this category. The MSCI World Index is a broad-based, market capitalization-weighted index comprising equity securities available in developed markets globally. The index was chosen for being a widely used benchmark of the global equity market. The index is not investible. See Important information – Global Equity category funds and Important information – MSCI World Index for additional details.
Amazon and Microsoft were in the top-20 holdings for all five funds, while Alphabet, Broadcom, Meta and NVIDIA were in the top-20 for four of them. Even in the middle of the A.I. transition, it looks like some active managers are already predicting the winners.
The cost of looking the same
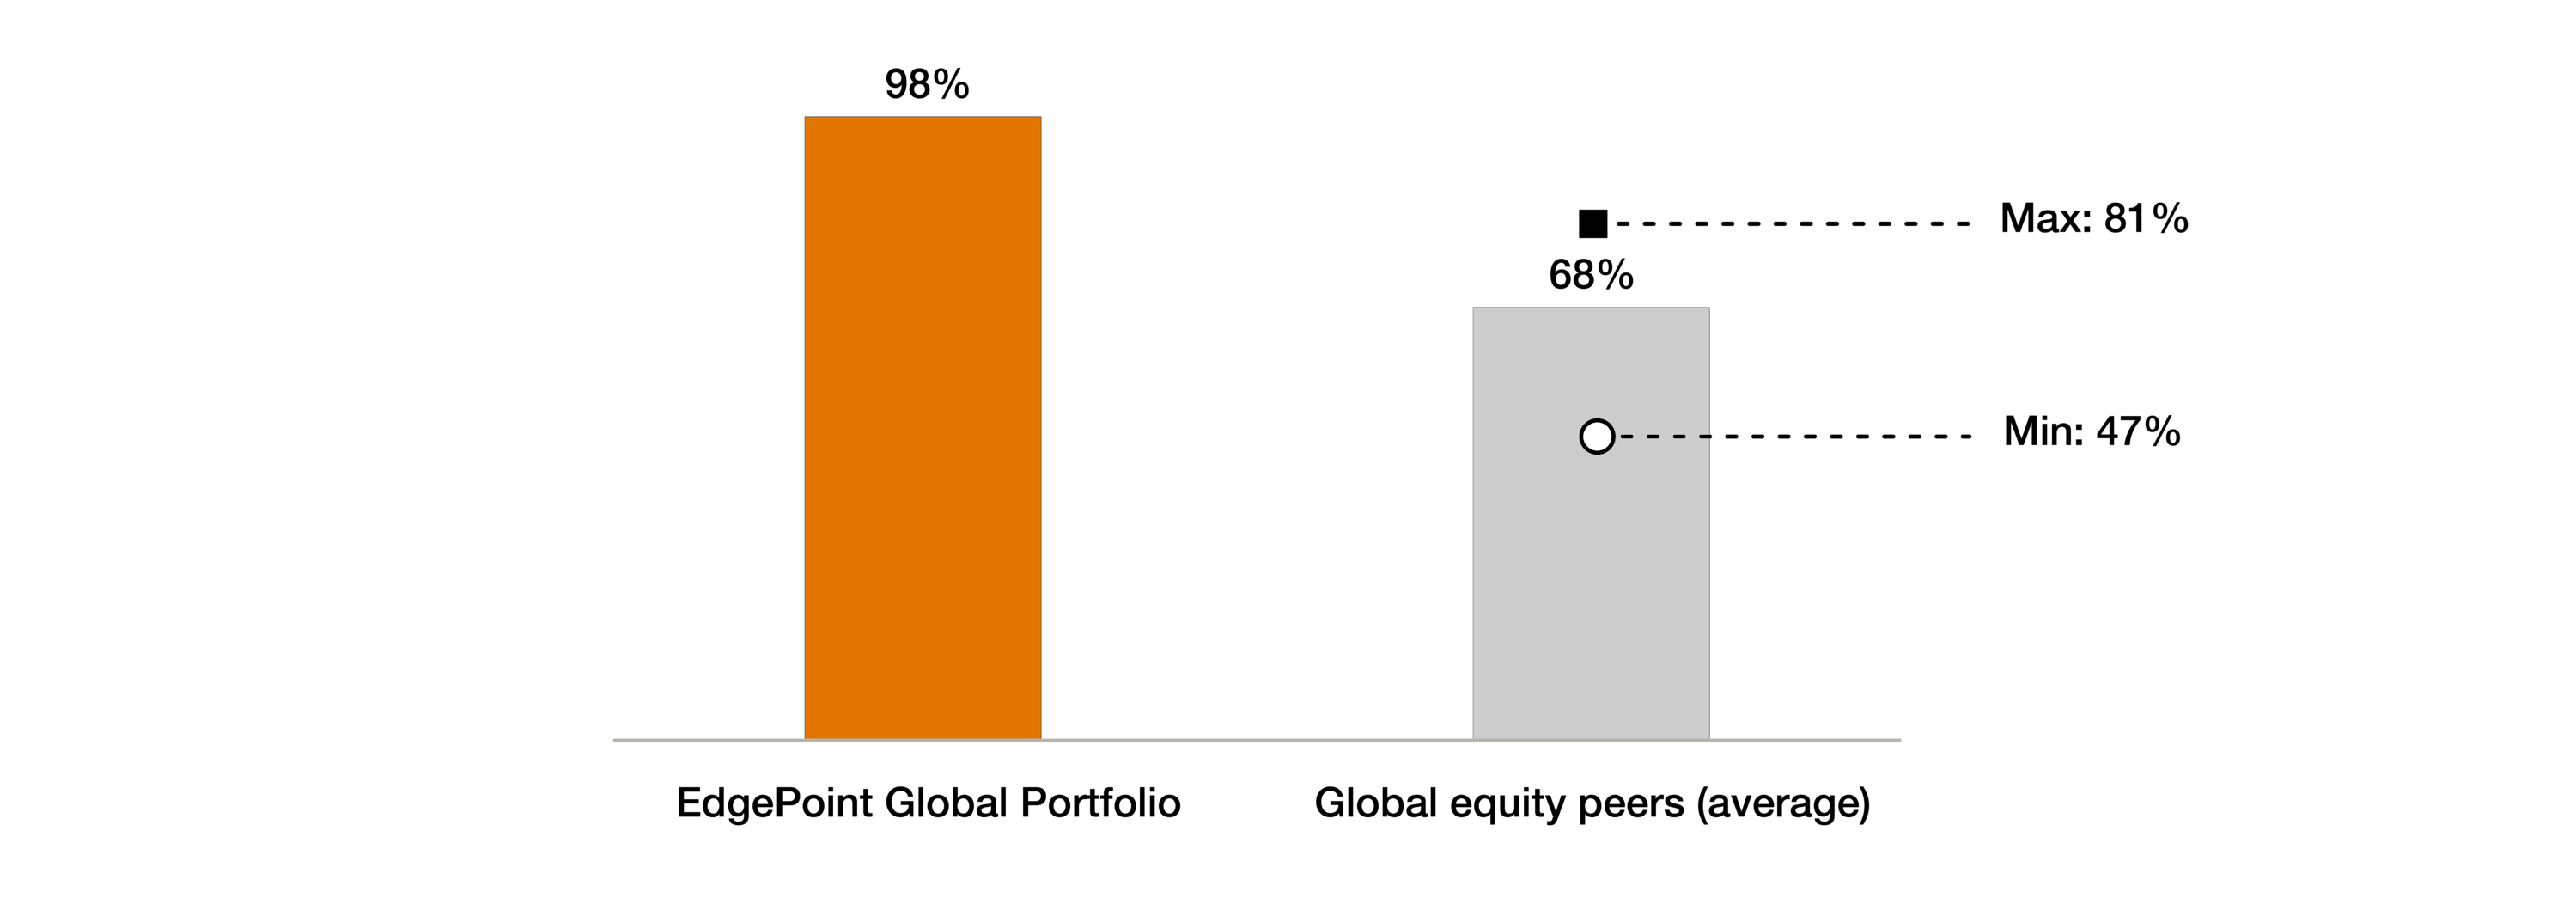
At EdgePoint, we believe that active management is the best way to build wealth over the long term. Unfortunately, some funds are active in name only. A pair of economists developed a metric to help investors determine if they were paying for truly active management or just a label. Active share measures the difference between a fund and its comparison index. A 100% active share means there’s no overlap, while 0% means they’re a perfect match. Here’s how EdgePoint Global Portfolio stacks up against its five largest Global Equity category peers:
EdgePoint Global Portfolio vs. Global Equity category peers – active share
As at Aug. 31, 2025
Source, active share: Morningstar Direct. As at August 31, 2025. Active share compares the differences between the equity holdings of a fund and its benchmark. It’s calculated as the sum of the difference between the weight of each stock in the portfolio and its benchmark weight, divided by two. Each funds prospectus benchmark was used to calculate active share. See Important information – Global Equity category funds for additional details.
As mentioned, active managers sometimes follow their benchmark to minimize tracking error, in order to reduce the likelihood of underperformance/getting fired (a.k.a., career risk). As investment managers have reduced their personal risk, they have increased it for their clients. A study has shown that clients invested in funds with lower active share tended to underperform compared to those with higher ratings when fees were taken into account:
| Active share | Annualized out/underperformance (after fees) |
|---|---|
| Less than 60% | -0.13% |
| 60% to 90% | 1.63% |
| Over 90% | 3.64% |
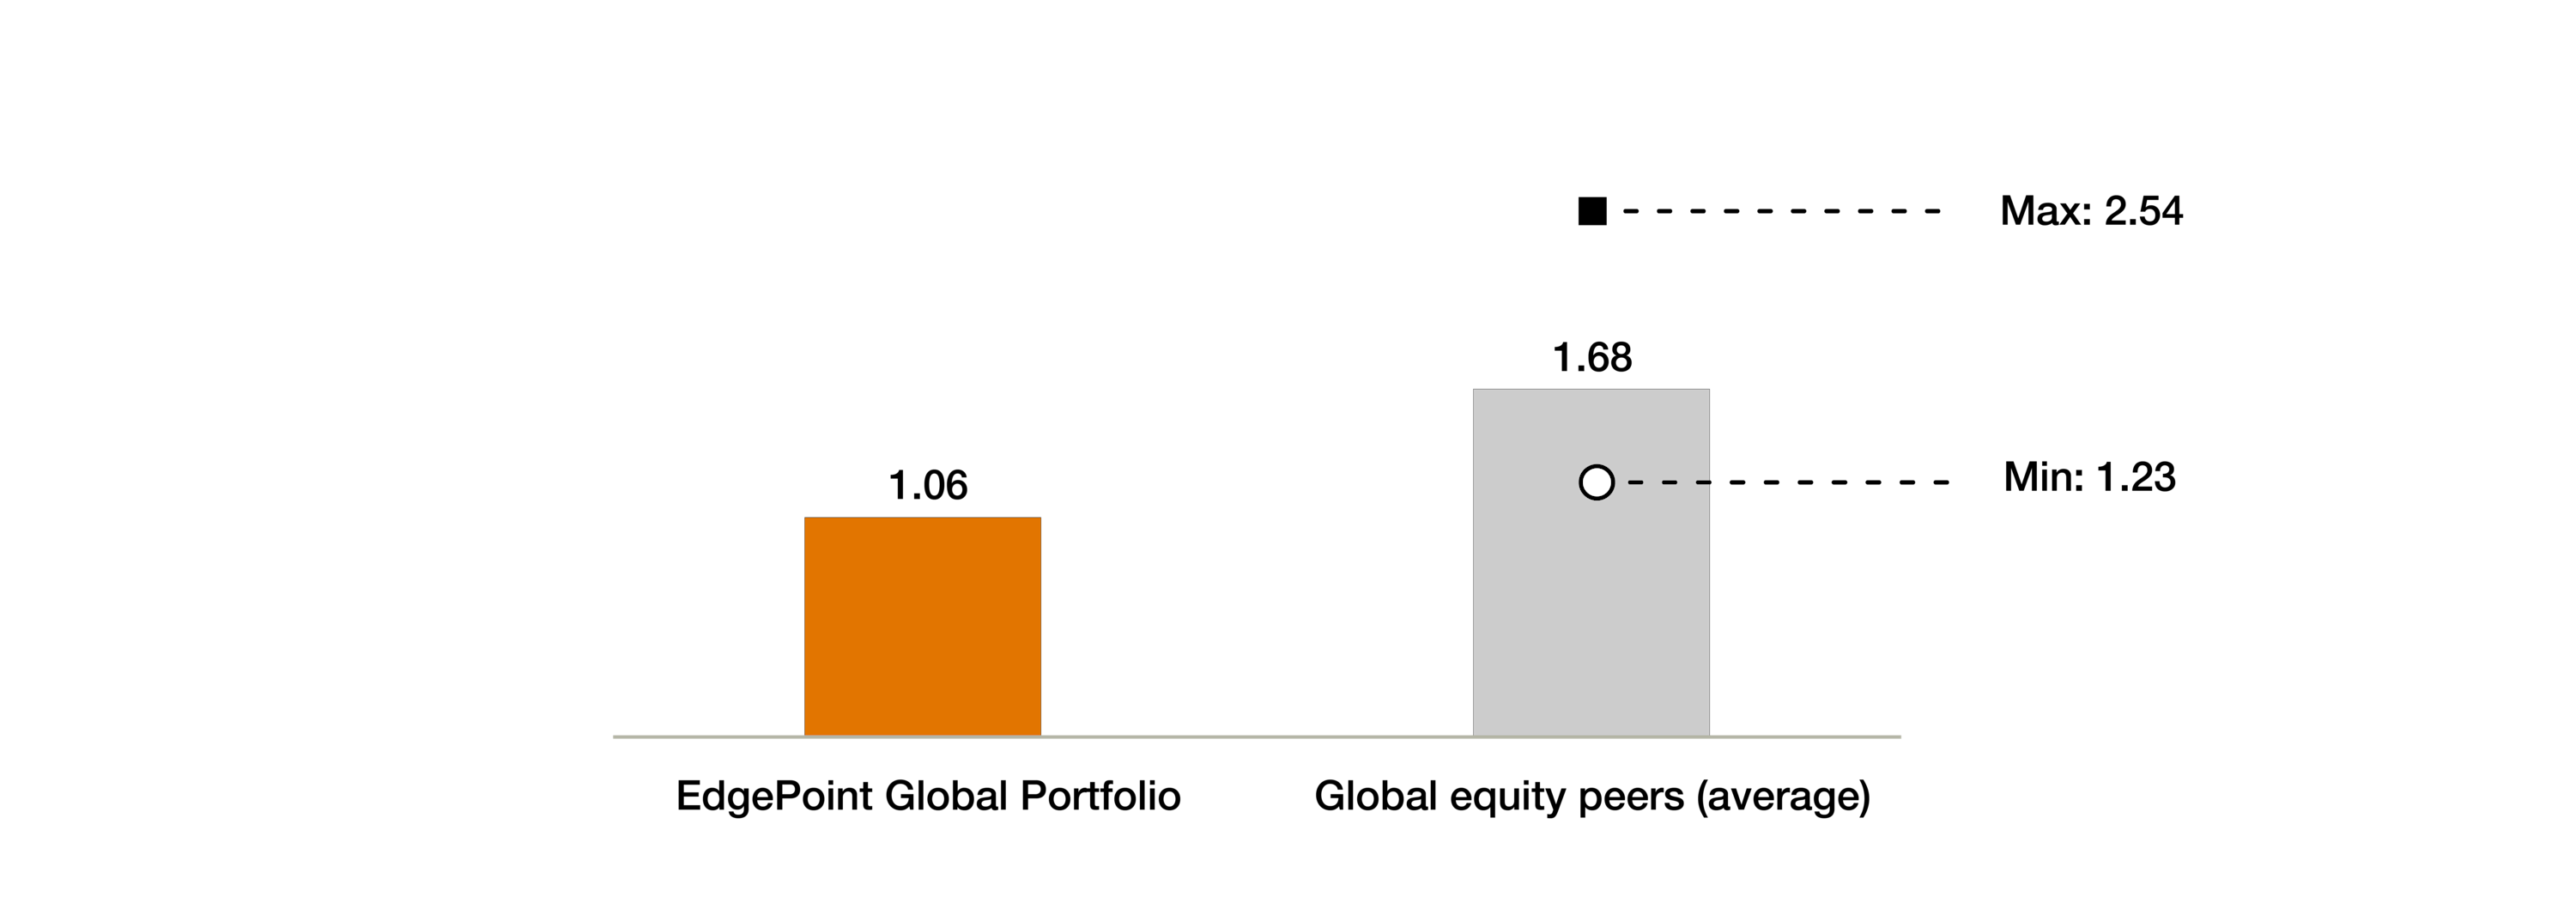
Besides those relative returns, investors are paying fees for that active (or “active”) management. Active cost is the ratio of a fund’s fees compared to its active share. The lower the number, the less you’re paying for active management. Relative to EdgePoint Global Portfolio, our peers’ active cost is 60% higher. This means that their managers are charging higher fees, yet provide less active management. Who likes to “pay more and get less”?
EdgePoint Global Portfolio vs. Global Equity category peers – active cost
As at Aug. 31, 2025
Source, active share: Morningstar Direct. Source, fees: company websites. As at August 31, 2025. Active cost is the sum of a fund’s management expense ratio (MER) and trading expense ratio (TER) divided by its active share. Active cost is not an industry-wide metric and was developed internally by EdgePoint. A no-load series was used to determine the fees for each fund. See Important information – Global Equity category funds for additional details.
Too big to succeed?
Part of the appeal of passive investing is diversification by owning a large collection of companies in a broad market index. There are over 1,300 holdings in the MSCI World Index today, yet over half of the index’s weight is in its 100 biggest constituents. Investors looking for an active alternative in our peers might be surprised to see how closely they track the index despite having an average of only 100 holdings each:
EdgePoint Global Portfolio vs. Global Equity category peers – portfolio weight of MSCI World Index holdings
As at Aug. 31, 2025

Source: FactSet Research Systems Inc. All data as at August 31, 2025, when there were a total of 1,320 securities in the MSCI World Index. Fund weights will not add up to 100% since it excludes cash and equivalents. Although three of the five Global Equity peers don’t use the MSCI World Index as a benchmark, the index is representative of equity securities available in developed markets globally. The MSCI World Index is a broad-based, market capitalization-weighted index comprising equity securities available in developed markets globally. The index is not investible. See Important information – Global Equity category funds and Important information – MSCI World Index for additional details.
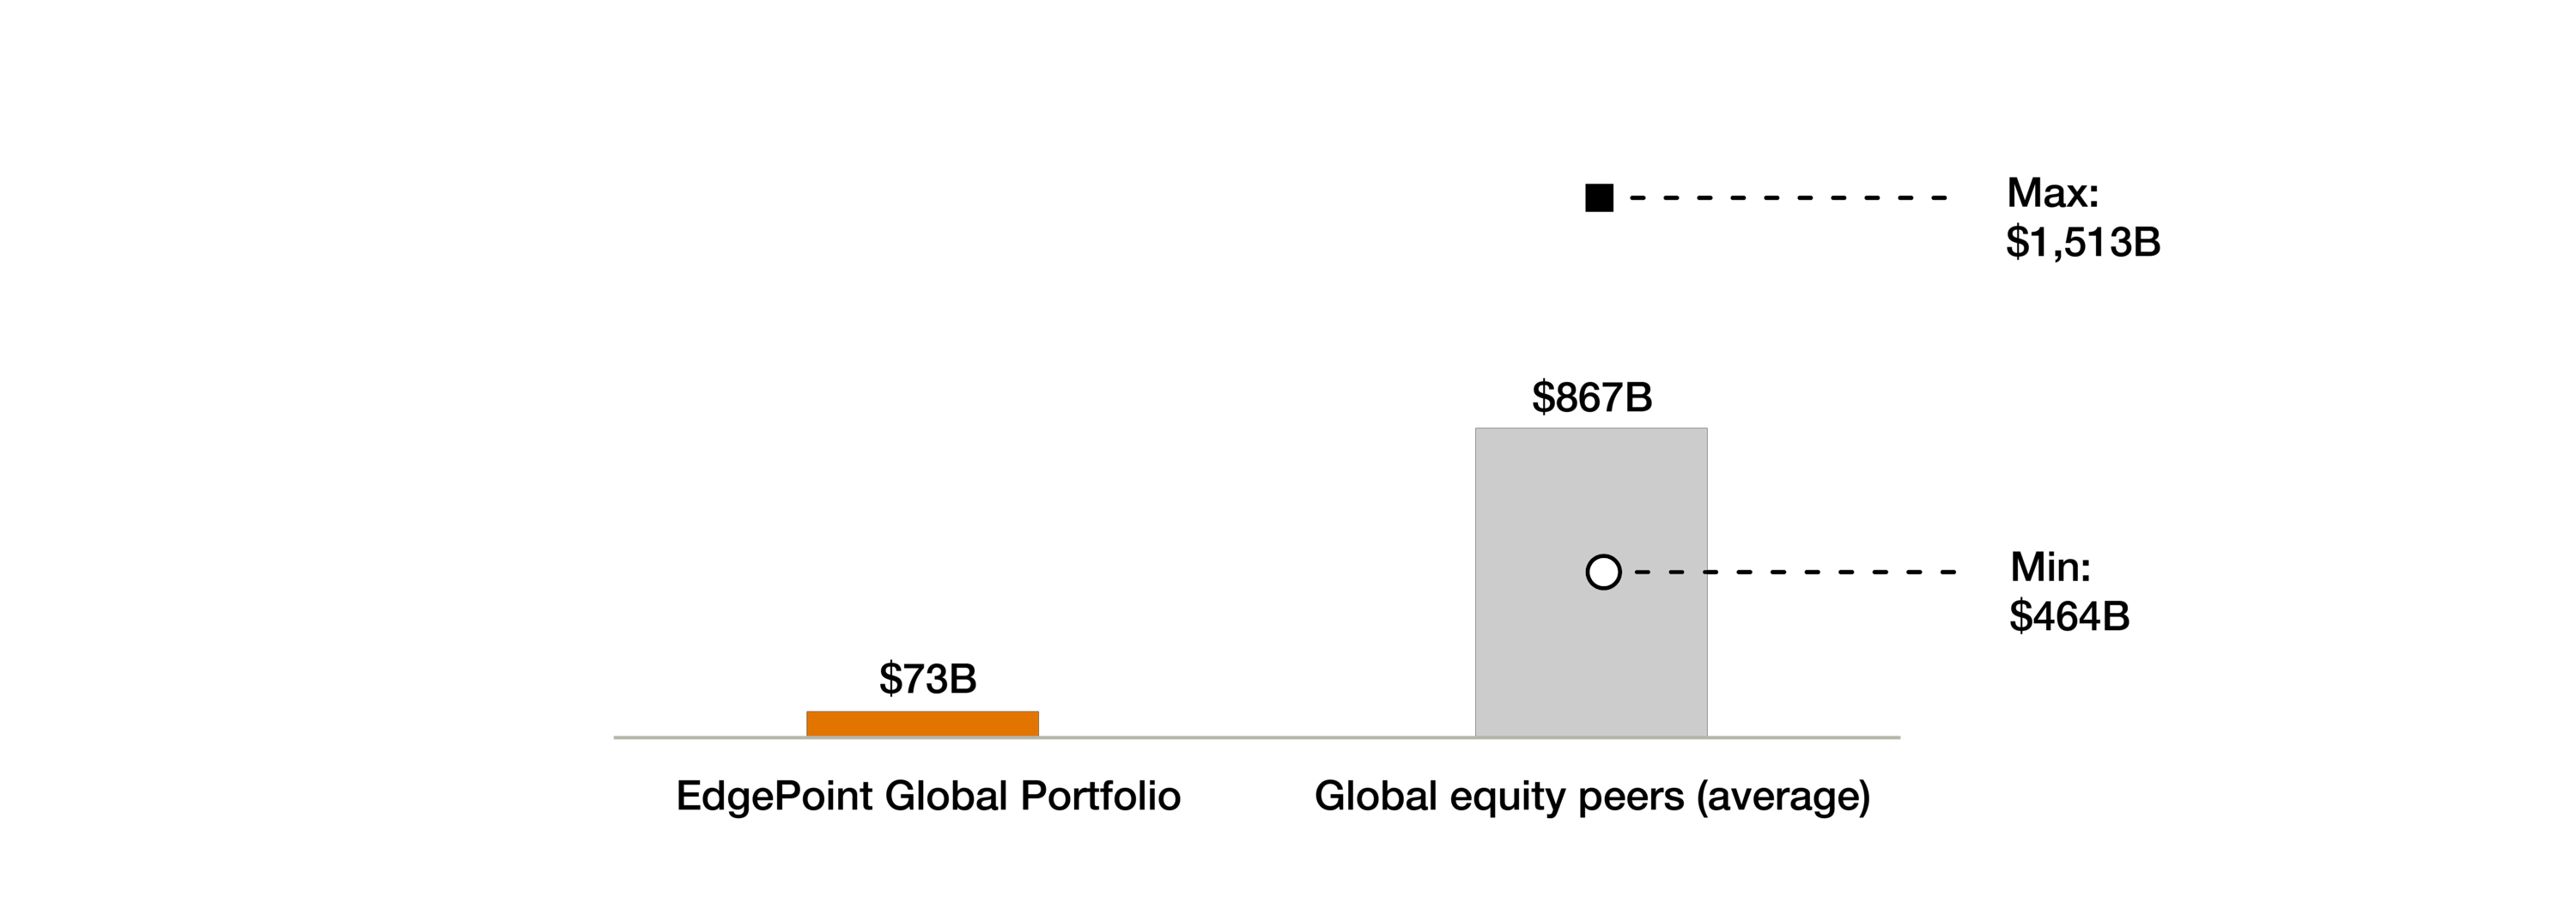
The average company in the EdgePoint Global Portfolio has a market cap of US$73 billion, compared to US$867 billion (or 12 times larger) for our five largest peers:
EdgePoint Global Portfolio vs. Global Equity category peers – weighted-average market cap (US$B)
As at Aug. 31, 2025
Source: Morningstar Direct. As at August 31, 2025. Average market cap is based on the latest available fund holdings. Excludes cash, fixed-income holdings, warrants and private companies. See Important information – Global Equity category funds for additional details.
To put this in perspective, only 11 (0.02%) of the more than 60,000 publicly traded companies globally have a market capitalization that large.ii This matters because entry price dictates return. We believe our companies have a much longer runway for growth. A US$73 billion business could double three times – to US$146 billion, then US$292 billion, then US$584 billion – and still be smaller than the average company in our five largest Global Equity peers (US$867 billion):
Average market cap (US$B)
As at Aug. 31, 2025

Source: FactSet Research Systems. As at August 31, 2025. Excludes cash, fixed-income holdings, warrants and private companies. The US$867 billion target for other funds is based on the weighted-average market cap from the top five funds by AUM in the Global Equity category as categorized by Morningstar, excluding EdgePoint Global Portfolio. This is a hypothetical scenario. Past performance is no guarantee of future results. See Important information – Global Equity category funds for additional details.
While not all of our peers’ holdings have a market capitalization of US$867 billion, let’s imagine what it would take their hypothetical average holding to double in size:
1st double ($US867 billion to $US1,734 billion): the market cap of JPMorgan (US$828 billion), the world’s largest bank
2nd double ($US1,734 billion to US$3,468 billion): over three-and-a-half times the market cap of Exxon Mobil Corp. (US$487 billion), the biggest oil company in the United States
3rd double (US$3,468 billion to $6,936 billion): the market cap of Microsoft (US$3,766B), the world’s second largest company
In the previous example, for the average-sized holding to double three times would require adding US$6.1 trillion in market cap. That’s a tall order considering a company would be required to increase its value by more than 150% of the world’s largest company, NVIDIA, which has a market cap of over US$4 trillion. By contrast, the average EdgePoint Global Portfolio holding can double multiple times and still be meaningfully smaller that than where our competitor’s holdings start today.
Roughly 60% of our investments are in companies with a market cap below US$25 billion. We believe these businesses have a far greater probability of growing multiples from here than, say, a company already worth nearly US$1 trillion. Smaller companies tend to fly under the radar – less covered by analysts and overlooked by index-driven investors simply because they don’t move the benchmark. Of the 60,000 publicly traded companies worldwide, more than 6,600 have a market value above US$2 billion – the threshold we’d typically consider for our Global Portfolio. That’s a wide hunting ground for opportunities to buy growth for free.
Lessons from the summit
The size of the world’s largest companies reminds me of an earlier interest of mine: mountain climbing. Into Thin Air by Jon Krakauer is a gripping first-person account of the 1996 Mount Everest disaster. On May 10 of that year, several expeditions attempted the summit, but a mix of overcrowding, delays, inexperienced climbers and a sudden storm led to tragedy. Interestingly, most high-altitude climbing fatalities happen not on the way up, but rather on the way down. This happens because of exhaustion, running out of bottled oxygen, descending in darkness or worsening weather.
Something similar happens with the largest companies. Becoming one of the 10 biggest U.S. companies is the financial equivalent of “reaching the summit”. Historically, the trip to the top has been more rewarding for investors than what happens after:
10 largest U.S. stocks by market cap – Total annualized excess returns relative to the U.S. market
In the 10 years before getting to the top, these companies outperformed the broader market by 12.1% per year, and in the five years prior, by 20.3% annually. But after they reach the summit, performance tends to lag over the next five and 10 years. Once you’re on top, there’s nowhere left to climb. As more investors focus on these giants, information gets quickly priced in, making it harder to generate alpha.
Going back to Engines that Move Markets, history tends to rhyme. A new technology emerges, early movers prosper, capital floods in, competition rises, supply builds, eventually returns decline and there’s a shakeout. The largest technology companies are now facing a shift of their own. For years, they benefited from capital-light models – write software once, sell it infinitely and watch profits outpace revenues – but that’s changing. Today, they’re all racing to build multi-billion-dollar data centres to train A.I. models. Capital expenditures among the four hyperscalers (Microsoft, Alphabet, Amazon and Meta) have soared from US$24 billion in 2015 to a projected US$400 billion by 2026.iii Big tech now spends a larger percentage of revenue on capital expenditures than Big Oil, which constantly needs to reinvest to replace depleting reserves.iv
We aren’t oblivious to the positive effects that A.I. will have on the world, similar to how the Internet changed the world. It’s important to remember that being right about the transformative impact of new technologies on society doesn’t necessarily mean the underlying securities are undervalued and investments made today will provide pleasing returns. Despite the lessons of history, many global funds have increasingly concentrated investor money into A.I. and have effectively made a bet on one idea. This seemingly implies conviction into what the future will look like, but given the rapidly changing landscape can anyone be sure of how things will play out?
Two hundred years ago, investors faced the “A.I. bubble” of their age: canals. On land, a horse pulling a cart could move about a ton of goods. Harnessed to a barge, the same horse could now haul 30 to 50 tons. This leap in efficiency cut transport costs by up to 90%, making it economical to move bulky goods far beyond their origin, shifting production inland and reshaping economies.
Canals were soon disrupted by an on-land competitor: railways. Trains carried goods faster, cheaper, and far more reliably. They ran year-round, unaffected by frozen waterways or drought, and unlike canals they weren’t confined to flat terrain or dependent on costly locks, aqueducts and tunnels. Railways could be built almost anywhere, offering flexibility and consistency that water transport could never match.
Portfolios made up of our best ideas
At EdgePoint, we invest with conviction. This means that our Portfolios are concentrated in what we believe to be our best ideas. Having fewer holdings allows them to each make a meaningful impact when the market recognizes what we believe to be their true value.
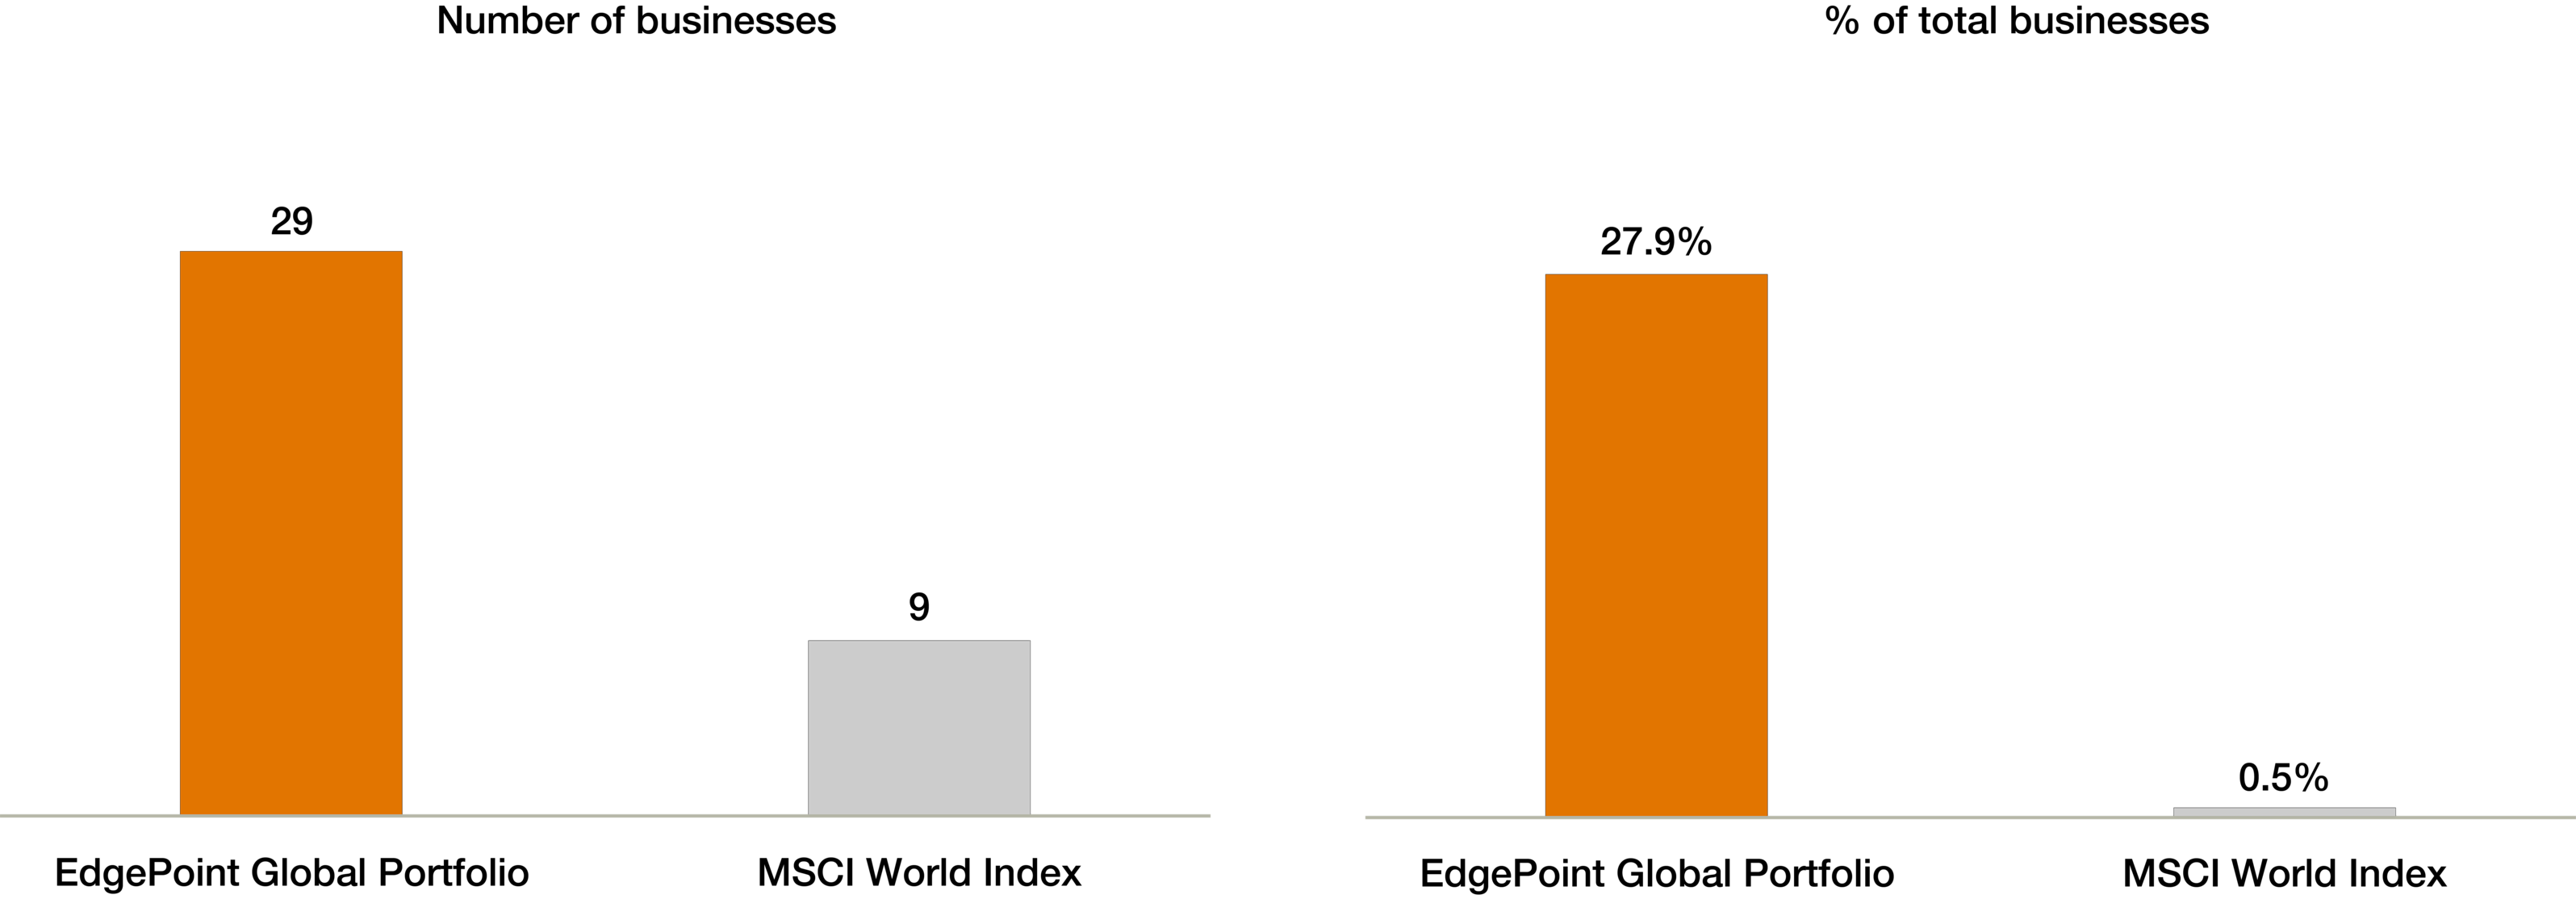
EdgePoint Global Portfolio has historically held between 40 to 50 companies at any time. Over the past five years, the MSCI World Index has included more than 1,900 businesses, yet only nine contributed more than 1% to overall performance. By contrast EdgePoint Global Portfolio owned 29 investments that each added more than 1% to our portfolio. As the chart on the right shows, 28% of our ideas generated a return to the portfolio above this threshold, compared to just 0.5% for the MSCI World.
EdgePoint Global Portfolio vs. MSCI World Index – businesses contributing at least 1% to performance
Aug. 31, 2020 to Aug. 31, 2025
Source: FactSet Research Systems Inc. Total returns to determine contribution impact was measured in C$. Over the last five years, the EdgePoint Global Portfolio held 104 different businesses, excluding warrants or any rights held within the Portfolio. The MSCI World Index is a broad-based, market capitalization-weighted index comprising equity securities available in developed markets globally. The index is not investible. See Important information – MSCI World Index for additional details.
These contributors had varying market caps, geographies and industries – evidence of our ability to identify positive change before it is reflected in share prices:
| Holding | Business | Country | Market Cap (US$B) |
|---|
EdgePoint Global Portfolio, Series F – Since inception (Nov. 17, 2008): 13.53%, 15-year: 12.51%, 10-year: 9.67%, 5-year: 12.37%, 3-year: 16.70%, 1-year: 13.32%, YTD: 12.93%.
*No longer held in the EdgePoint Global Portfolio as at August 31, 2025
Source: FactSet Research Systems Inc. Total returns to determine contribution impact was measured in C$. The businesses listed above represent securities held within the EdgePoint Global Portfolio over the last five years that contributed more than 1% to the Portfolios performance. Country classifications are based on head office location. Market capitalizations are in US$ and are as at the date of sale for each security or August 31, 2025 for businesses still held within the Portfolio. Information on the above securities are solely to illustrate the application of the EdgePoint investment approach and not intended as investment advice. It is not representative of the entire portfolio, nor is it a guarantee of future performance. EdgePoint Investment Group Inc. may be buying or selling positions in the above securities.
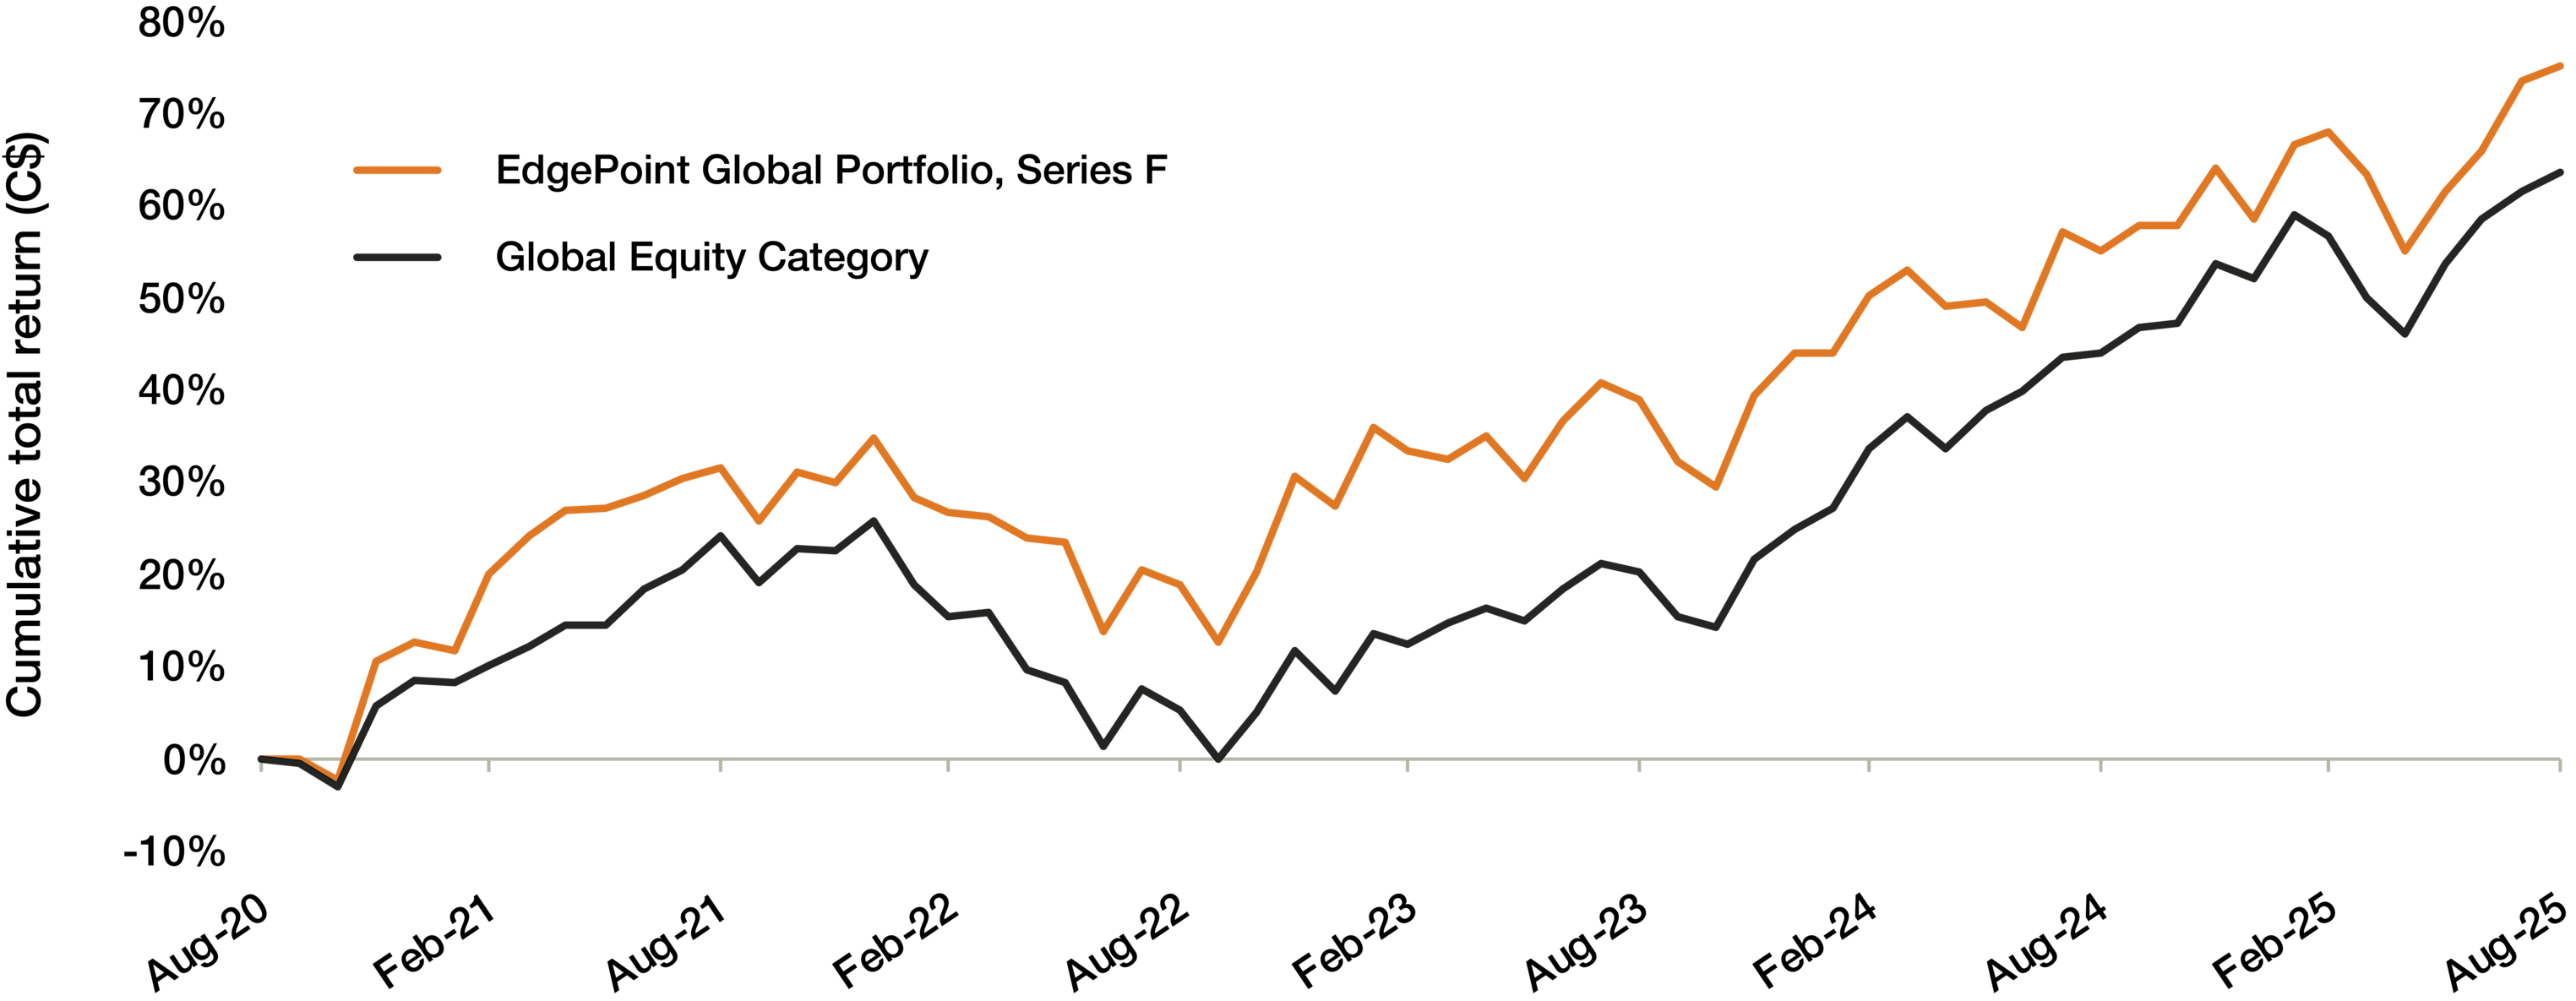
We aren’t cherry picking these stocks. They’ve combined to benefit our end clients through a volatile five-year period marked by COVID-19 lockdowns, supply chain disruptions, inflation, rising interest rates, wars and tariffs. EdgePoint has consistently uncovered undervalued opportunities without paying for growth, and has outperformed our peers in the Global Equity category by 1.6% annualized over the last five years:
EdgePoint Global Portfolio, Series F vs. Global Equity Category – Total returns (C$)
Aug. 31, 2020 to Aug. 31, 2025
Annualized total returns, net of fees (excluding advisory fees), in C$. As at September 30, 2025
EdgePoint Global Portfolio, Series F – Since inception (Nov. 17, 2008): 13.53%, 15-year: 12.51%, 10-year: 9.67%, 5-year: 12.37%, 3-year: 16.70%, 1-year: 13.32%, YTD: 12.93%;
Global Equity category (average): 15-year: 10.01%, 10-year: 9.62%, 5-year: 11.14%, 3-year: 18.96%, 1-year: 15.45%, YTD: 11.51%;
Number of funds in the Global Equity category: 15-year: 359, 10-year: 699, 5-year: 1,304, 3-year: 1,584, 1-year: 1,810, YTD: 1,824.
Source: Morningstar Direct. As at August 31, 2025. Total returns, net of fees (excluding advisory fees), in C$. The above values are for illustrative purposes only, do not represent an actual client’s results and aren’t indicative of future performance. Series F is available to investors in a fee-based/advisory fee arrangement and doesn’t require EdgePoint to incur distribution costs in the form of trailing commissions to dealers. See Important information – Global Equity category funds for additional details.
Growth over the long term
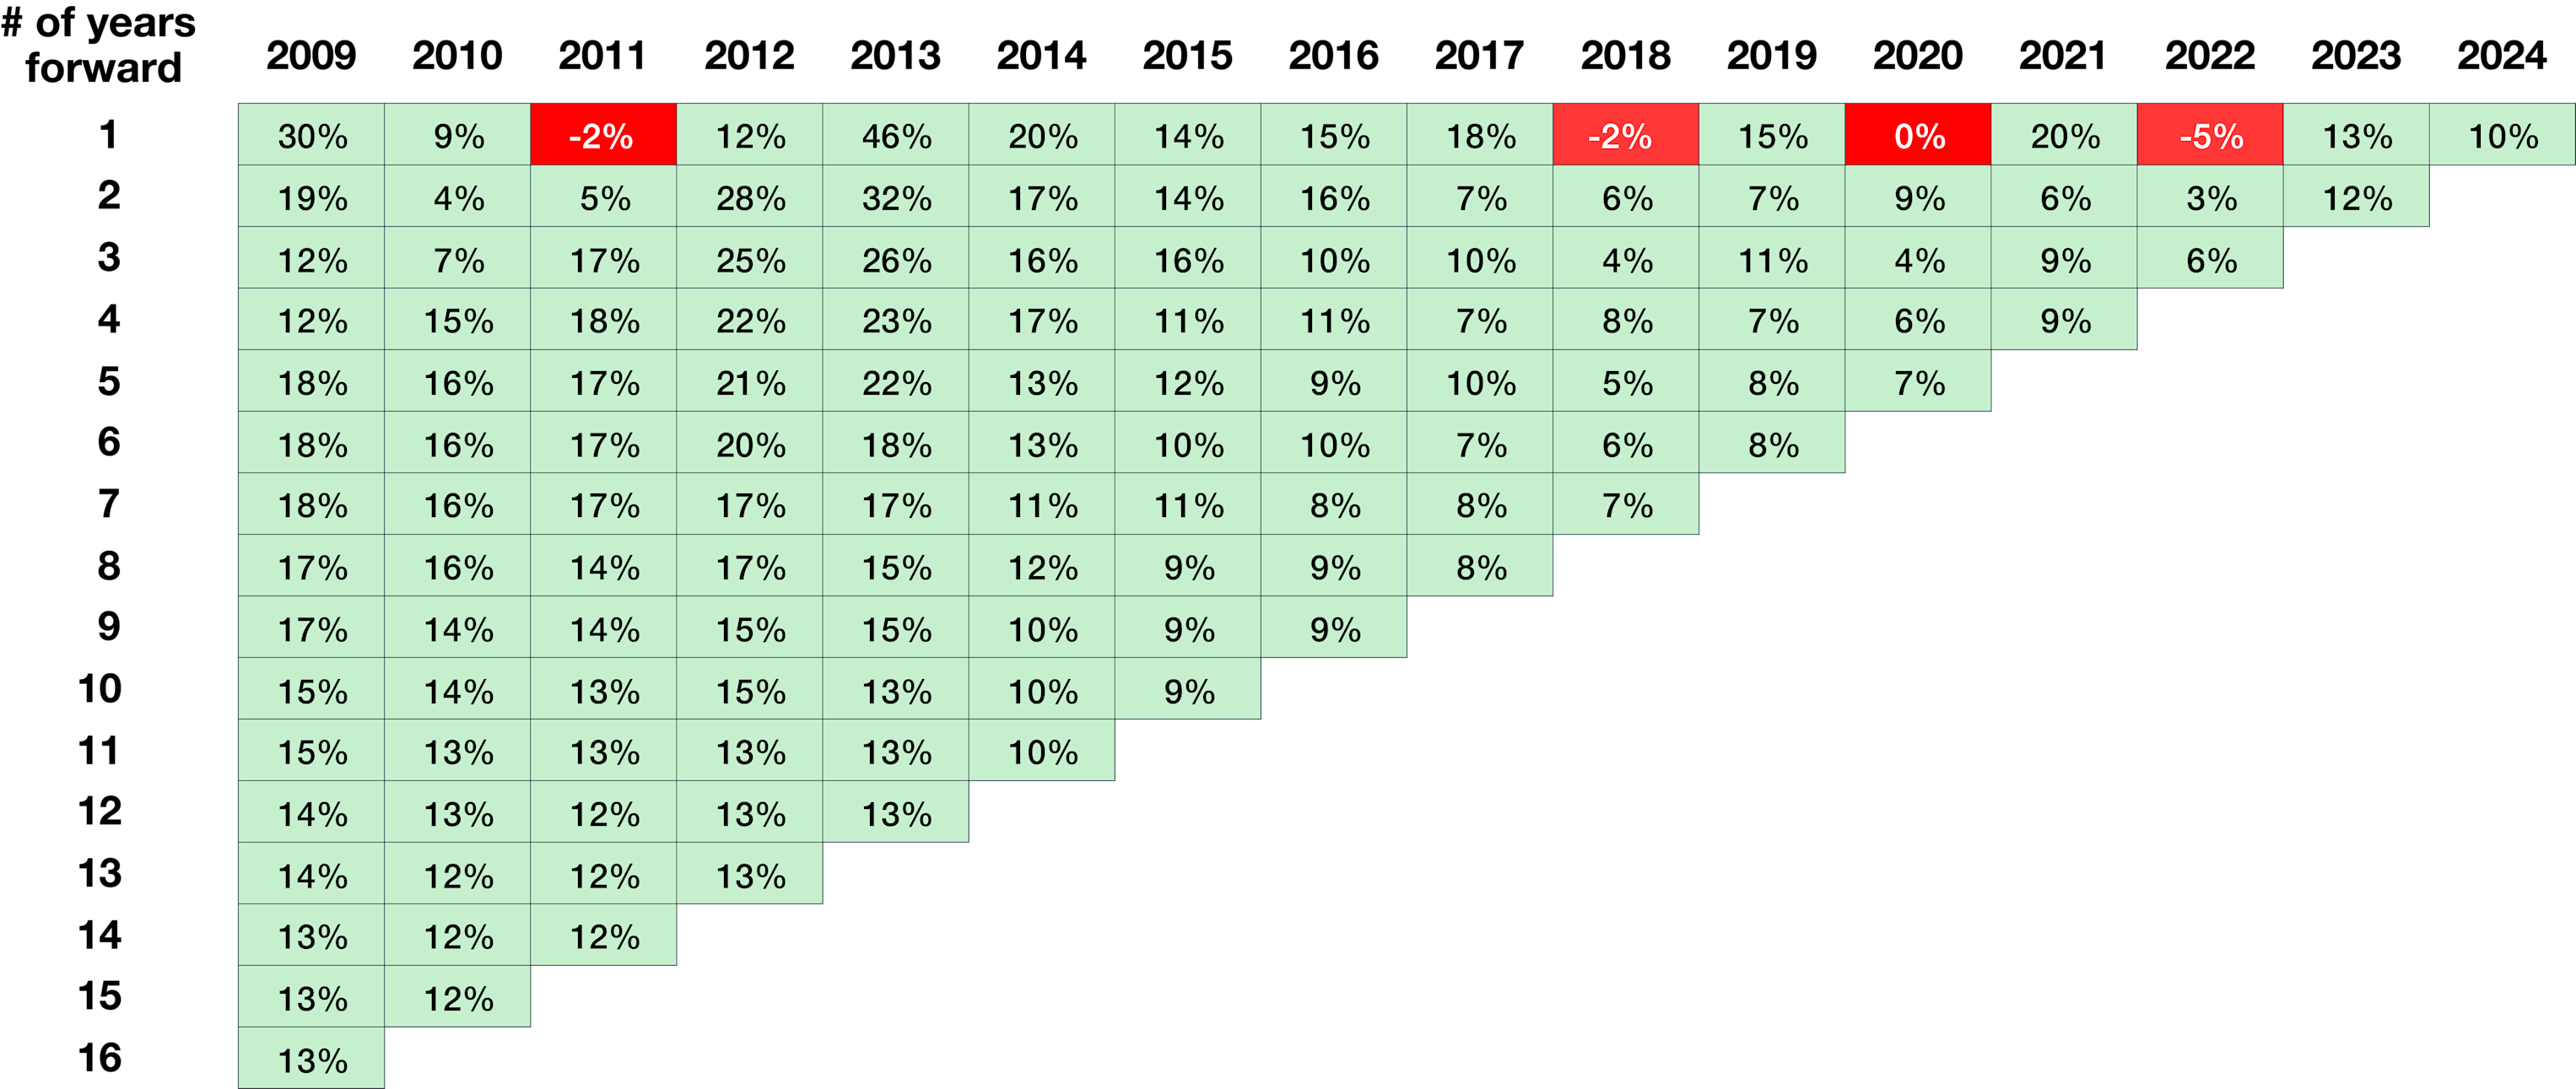
The journey so far has had short-term volatility, but investors in EdgePoint Global Portfolio who entrusted their money to us over time have rarely been impaired over the long term. The following table shows annualized returns depending on when you first invested (horizontal axis) and for how long you invested (vertical axis). For example, investing on Jan 1, 2009 would have produced a 30% one-year return (first column going down), a 19% two-year annualized return, and a 13% return annualized return over 16 years. Returns are colour coded: green for gains and red for losses. Since our founding in 2008, there have only been four periods of negative annual returns, each lasting for just one year. That’s our discipline at work.
EdgePoint Global Portfolio, Series F – Annualized forward total returns (C$)
Annualized total returns, net of fees (excluding advisory fees), in C$. As at September 30, 2025
EdgePoint Global Portfolio, Series F – Since inception (Nov. 17, 2008): 13.53%, 15-year: 12.51%, 10-year: 9.67%, 5-year: 12.37%, 3-year: 16.70%, 1-year: 13.32%, YTD: 12.93%.
Total returns net of fees, excluding advisory fees, in C$. Annual returns were used in all calculations above. 2009 was the first full calendar year for the EdgePoint Global Portfolio, which was launched on November 17, 2008. Periods with a negative return are highlighted in red. Forward returns are calculated from the first calendar day of each starting year on the chart referenced above. Periods greater than one-year are annualized. The above values are for illustrative purposes only, do not represent an actual client’s results and aren’t indicative of future performance. Series F is available to investors in a fee-based/advisory fee arrangement and doesn’t require EdgePoint to incur distribution costs in the form of trailing commissions to dealers.
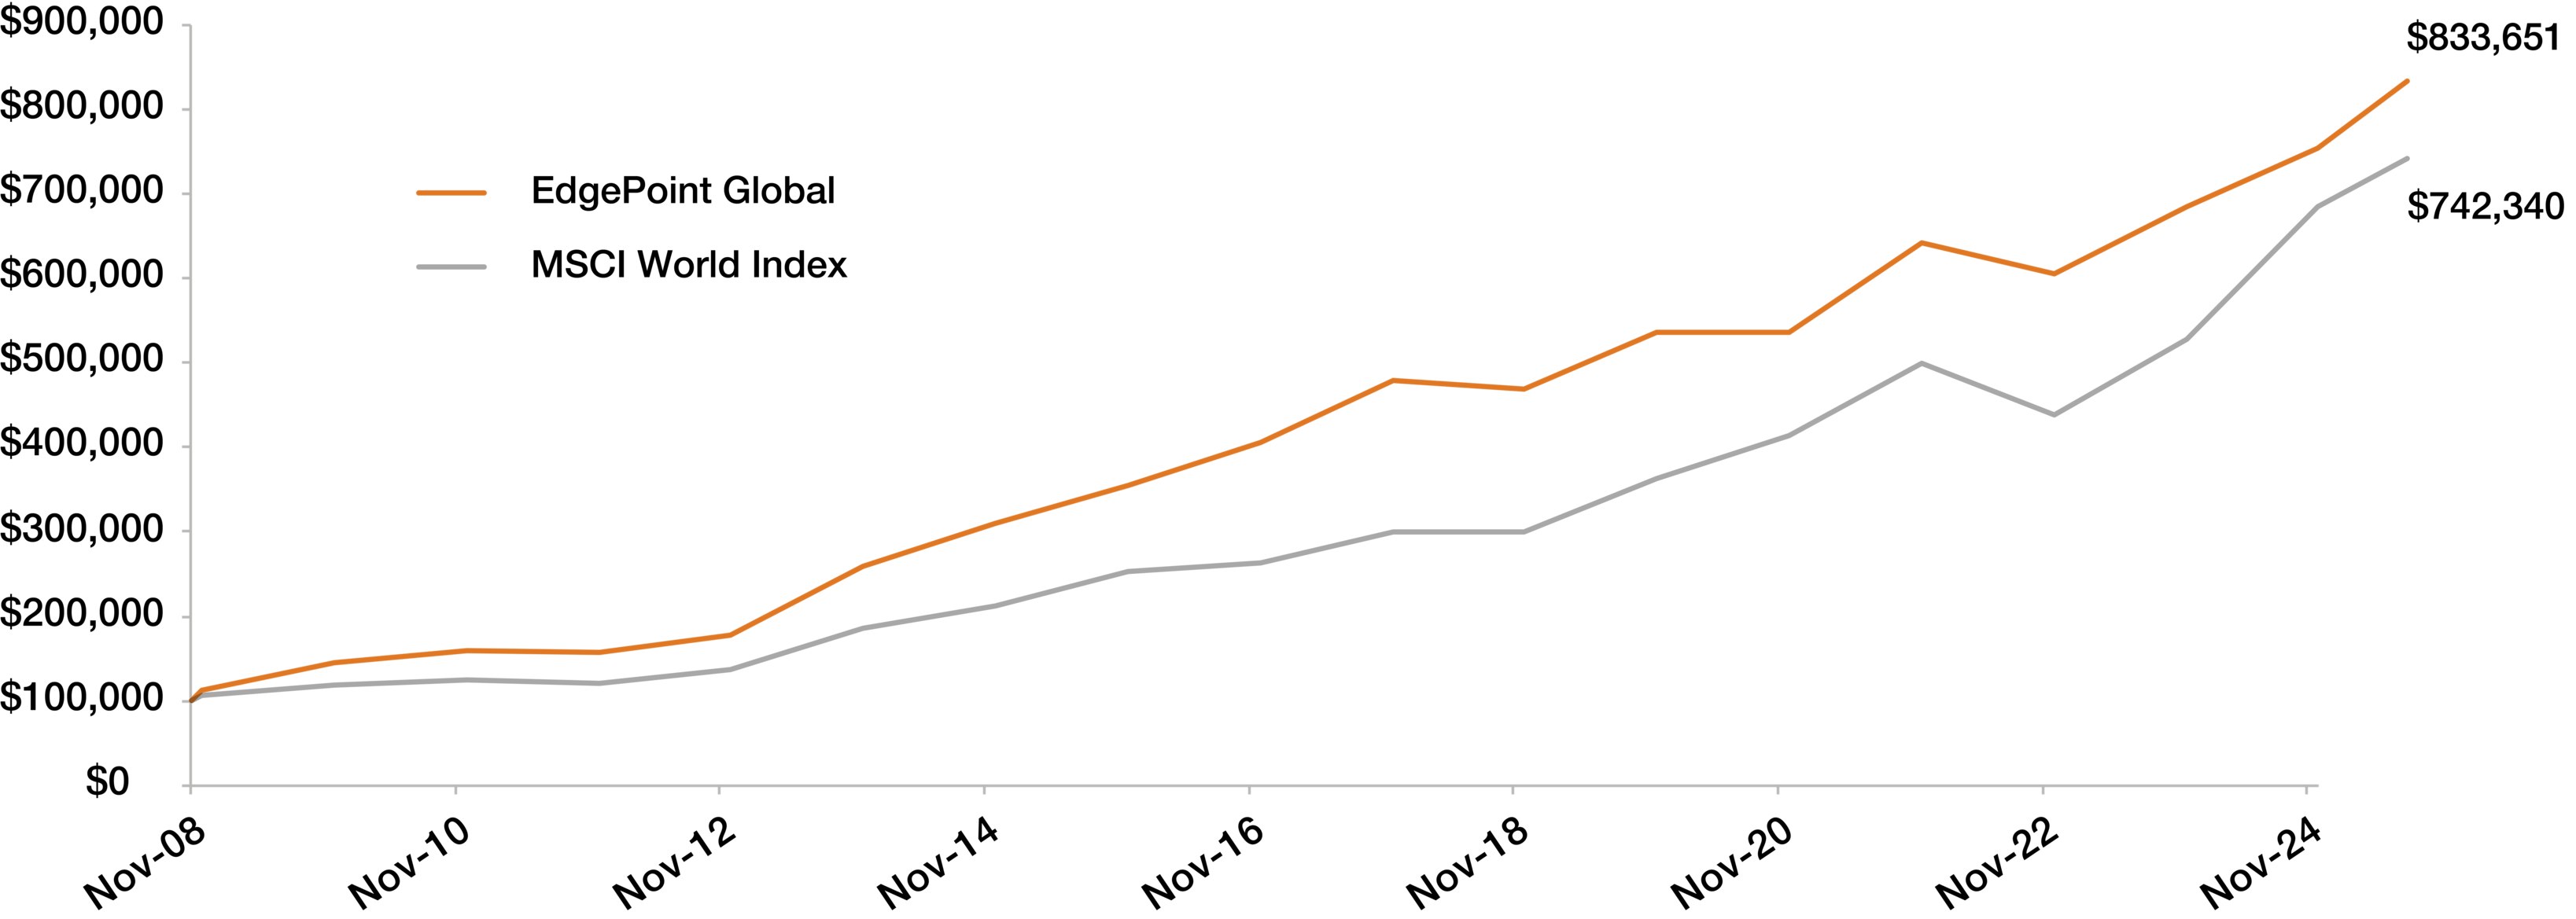
Longer term, EdgePoint Global Portfolio investors who have been with us since inception (2008) have benefitted from growth that’s outperformed the benchmark:
EdgePoint Global Portfolio, Series F vs MSCI World Index – Growth of C$100,000
Nov. 17, 2008 to Aug. 31, 2025
Annualized total returns, net of fees (excluding advisory fees), in C$. As at September 30, 2025
EdgePoint Global Portfolio, Series F – Since inception (Nov. 17, 2008): 13.53%, 15-year: 12.51%, 10-year: 9.67%, 5-year: 12.37%, 3-year: 16.70%, 1-year: 13.32%, YTD: 12.93%;
MSCI World Index – Since EdgePoint Portfolio inception (Nov. 17, 2008): 12.92%; 15-year: 13.31%; 10-year: 12.84%, 5-year: 15.35%, 3-year: 24.23%, 1-year: 20.76%, YTD: 13.61%.
Series F is available to investors in a fee-based/advisory fee arrangement and doesn’t require EdgePoint to incur distribution costs in the form of trailing commissions to dealers. Performance figures shown for illustrative purposes only and aren’t indicative of future performance.
The more things change…
The patterns that form around varying technological innovations appear to be consistent over time, similar to how the investment approach we apply at EdgePoint has stayed the same since we launched since 2008. We recognize the immense responsibility of managing and growing our clients’ savings. Our partnership with like-minded advisors has resulted in the average EdgePoint Global Portfolio unitholder achieving a 10-year return of 9.74%, which has slightly outperformed the Portfolio’s return of 9.67%.v
We treat our end clients money like it was our own and show our conviction by investing over C$400 million alongside our clients. We remain fully aligned in pursuing long-term value where we can buy growth without paying for it to help get you and your clients to Point B.vi
Thank you for your trust and partnership.