This is Dolly. She was a female Finn-Dorset sheep whose claim to fame was being the first mammal to be successfully cloned from a non-embryonic cell. Born on July 5, 1996 at the Roslin Institute in Scotland, Dolly had three mothers – one provided the egg, another the DNA transferred into the egg and a third carried the cloned embryo until birth.
Dolly’s birth was a significant scientific breakthrough and opened new avenues of research into regenerative medicine involving stem cells. There was also controversy – it raised ethical questions about the use of cloning in humans. Despite concerns that cloning might lead to accelerated aging, Dolly passed away at the ripe age of six years from a common condition. Her effect on science lives on, as more than 20 different animal species have since been successfully cloned.
Ctrl+C, Ctrl+V investing – the copycat world of "mutual fund" companies
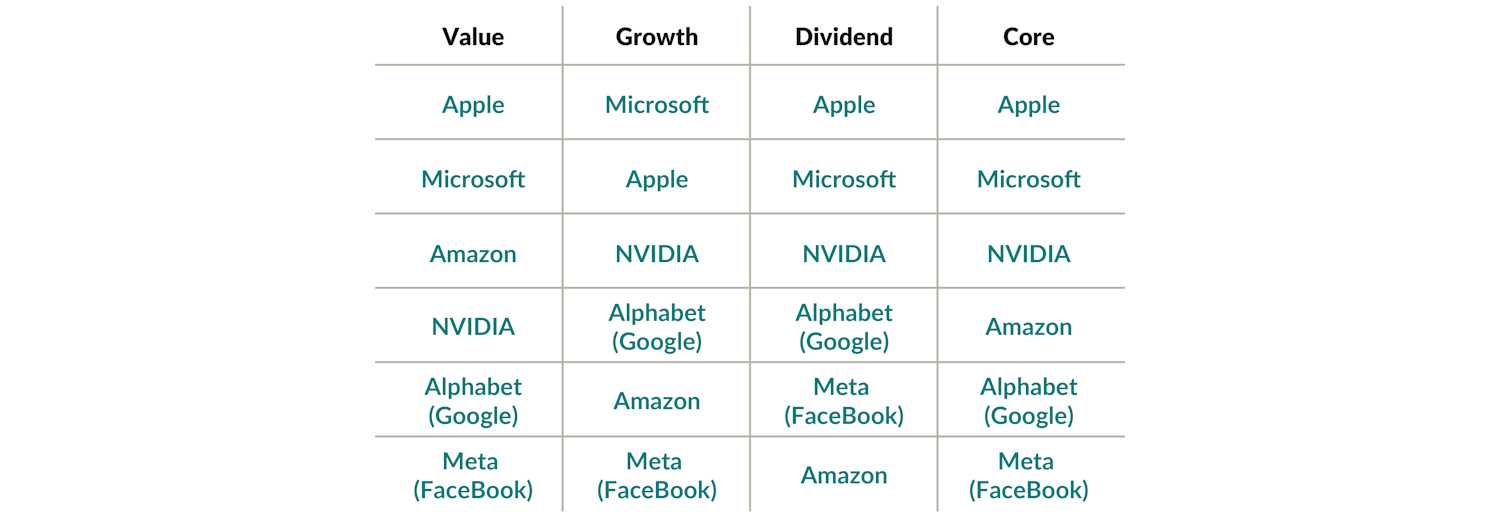
So, what does Dolly and cloning have to do with investing? Look at the recent top holdings of one fund company’s four distinct U.S. equity funds:

The remains of Dolly the Sheep were preserved and can be visited at the National Museum of Scotland in Edinburgh.
Fund company – Top 6 holdings
As at Aug. 31, 2024
Source: Morningstar Direct. September 30, 2024 holdings were not yet available.
This wasn’t a copy-and-paste error – there’s a 100% overlap among them. Four different fund mandates with four different portfolio managers, and yet they all own the same top six holdings. Why does a “value” fund have the exact same holdings as a “growth” fund which is also the same as the dividend and core funds? Hello, Dolly!
Sheep in wolf's clothing – the surprising similarity among global equity funds
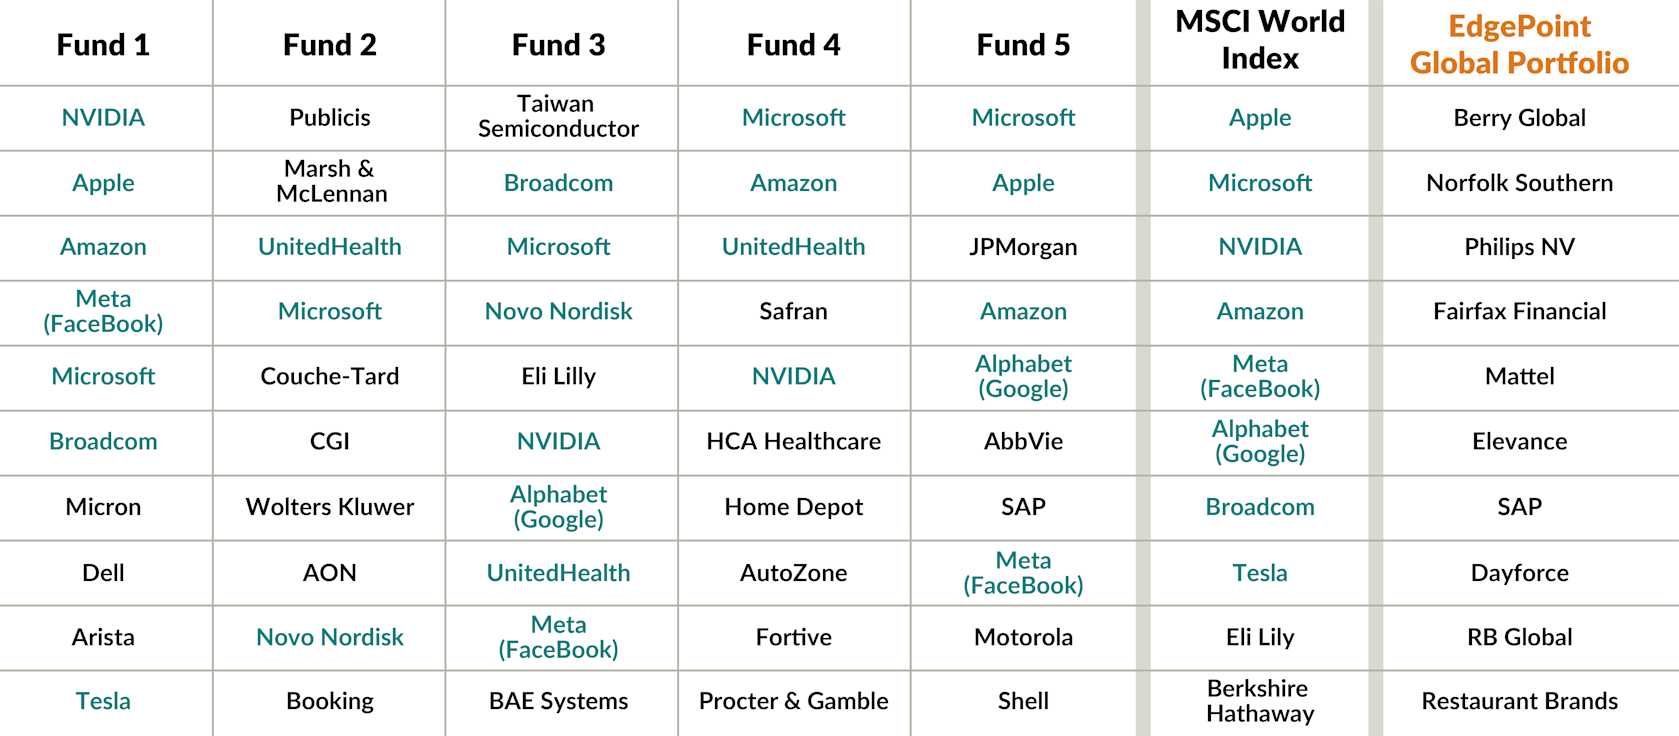
Shown below are the top 10 holdings of the five largest Global Equity Funds in Canada and the MSCI World Index. Unlike EdgePoint Global Portfolio, there is a significant overlap between the five largest competitor funds and the Index. They’ve placed a significant amount of capital within a select group of highlighted large cap stocks – the “Magnificent 7” (Amazon, Apple, Google parent Alphabet, Microsoft, Nvidia, Meta and Tesla) and three companies in the tech or healthcare space (Broadcom, UnitedHealth, Novo Nordisk).
Global Equity funds vs. the MSCI World Index – Top-10 holdings
As at September 30, 2024
Source: Morningstar Direct. The above are the five largest funds, excluding funds of funds and clone funds, in the Global Equity category as at September 30, 2024. See Important information – Global Equity categories for additional details.
*Mutual funds are not guaranteed, their values change frequently and past performance may not be repeated. This is not an offer to purchase. Mutual funds can only be purchased through a registered dealer and are available only in those jurisdictions where they may be lawfully offered for sale.
Out of 50 total holdings, those 10 stocks account for 52% (26) of the holdings. Fund managers copy an index’s holdings to minimize their risk of underperformance, or what we call closet indexing.
To put that in perspective, we can look at commonly used Global Equity benchmark indexes. The MSCI World Index consists of over 1,400 companies across developed markets, while the MSCI All-Country World Index includes over 2,600 businesses in both developed and emerging economies.i While most global fund managers have a large universe of potential stocks to choose from, they all seem to own the same 10 stocks which on average comprise over half of their top-10 holdings. That’s a statistical outlier!
Given the size of assets in these funds, they’re broadly owned across Canada. Investors might think their portfolio is diversified because they invested with multiple fund companies. They might be in for an unwelcome surprise since these funds have high overlap and own many of the same stocks.
Following the consensus is wise in most professions. If you wanted to build a new bridge, you would want to follow the standards that experts agree on because the risks of deviating from established practices could be catastrophic. Investing is different because following the crowd, doing what everyone else is doing, almost always leads to underperforming over time. The cost of fitting in means paying more for these popular stocks. Higher entry prices increase the risk of permanent loss of capital when both the enthusiasm and share price fade.
Dolly's dark legacy – the silent death of active management
There’s a reason why investors invest with managers who are active in more than just name alone. There’s a correlation between greater active management and relative performance to a benchmark. “Active share” explains how different a portfolio is compared to an index. Funds with higher active share of 90% or above (i.e., very different from benchmark) have historically performed better than the index while funds with low active ratio of 60% or below (similar to index) have underperformed.
| Active share | Annualized out/underperformance (after fees) |
|---|---|
| Less than 60% | -0.13% |
| 60% to 90% | 1.63% |
| Over 90% | 3.64% |
This herd mentality has resulted in a flock of index clones that promise active management (and charge for it), yet their investors aren’t getting what they paid for. It’s tough to outperform the index when you own many of the same holdings as the index and demand high fees – unitholders can simply save their money by buying an index fund. Imitation might be the sincerest form of flattery, but these companies seem to be insulting their clients’ intelligence.
Global investors have inadvertently become the mutual fund equivalent of Dolly – clones of each other as these funds all seek to minimize the risk of underperforming the index by essentially owning the index itself. Their focus has shifted from analyzing fundamentals of individual companies and looking for areas of inefficiency where stocks are mispriced, to “what’s the weight in the index?” Fund managers buy these stocks to reduce their personal career risk, while at the same time increasing the financial risks to their clients.
Even worse is when the “active management” drifts away from its original investment mandate. “Truth in advertising” is the principle that advertisements should be honest, accurate and not misleading. One of the previously mentioned Global Equity funds classifies itself as a “global dividend” fund, yet owns the following securities:
| Security | Dividend yield |
|---|---|
| Amazon | 0.00% |
| Nvidia* | 0.03% |
| Meta | 0.35% |
| Apple | 0.43% |
| Alphabet | 0.48% |
| Microsoft | 0.77% |
Source: Bloomberg LP. As at September 30, 2024.
The clone wars – the hidden risks of homogeneity in markets
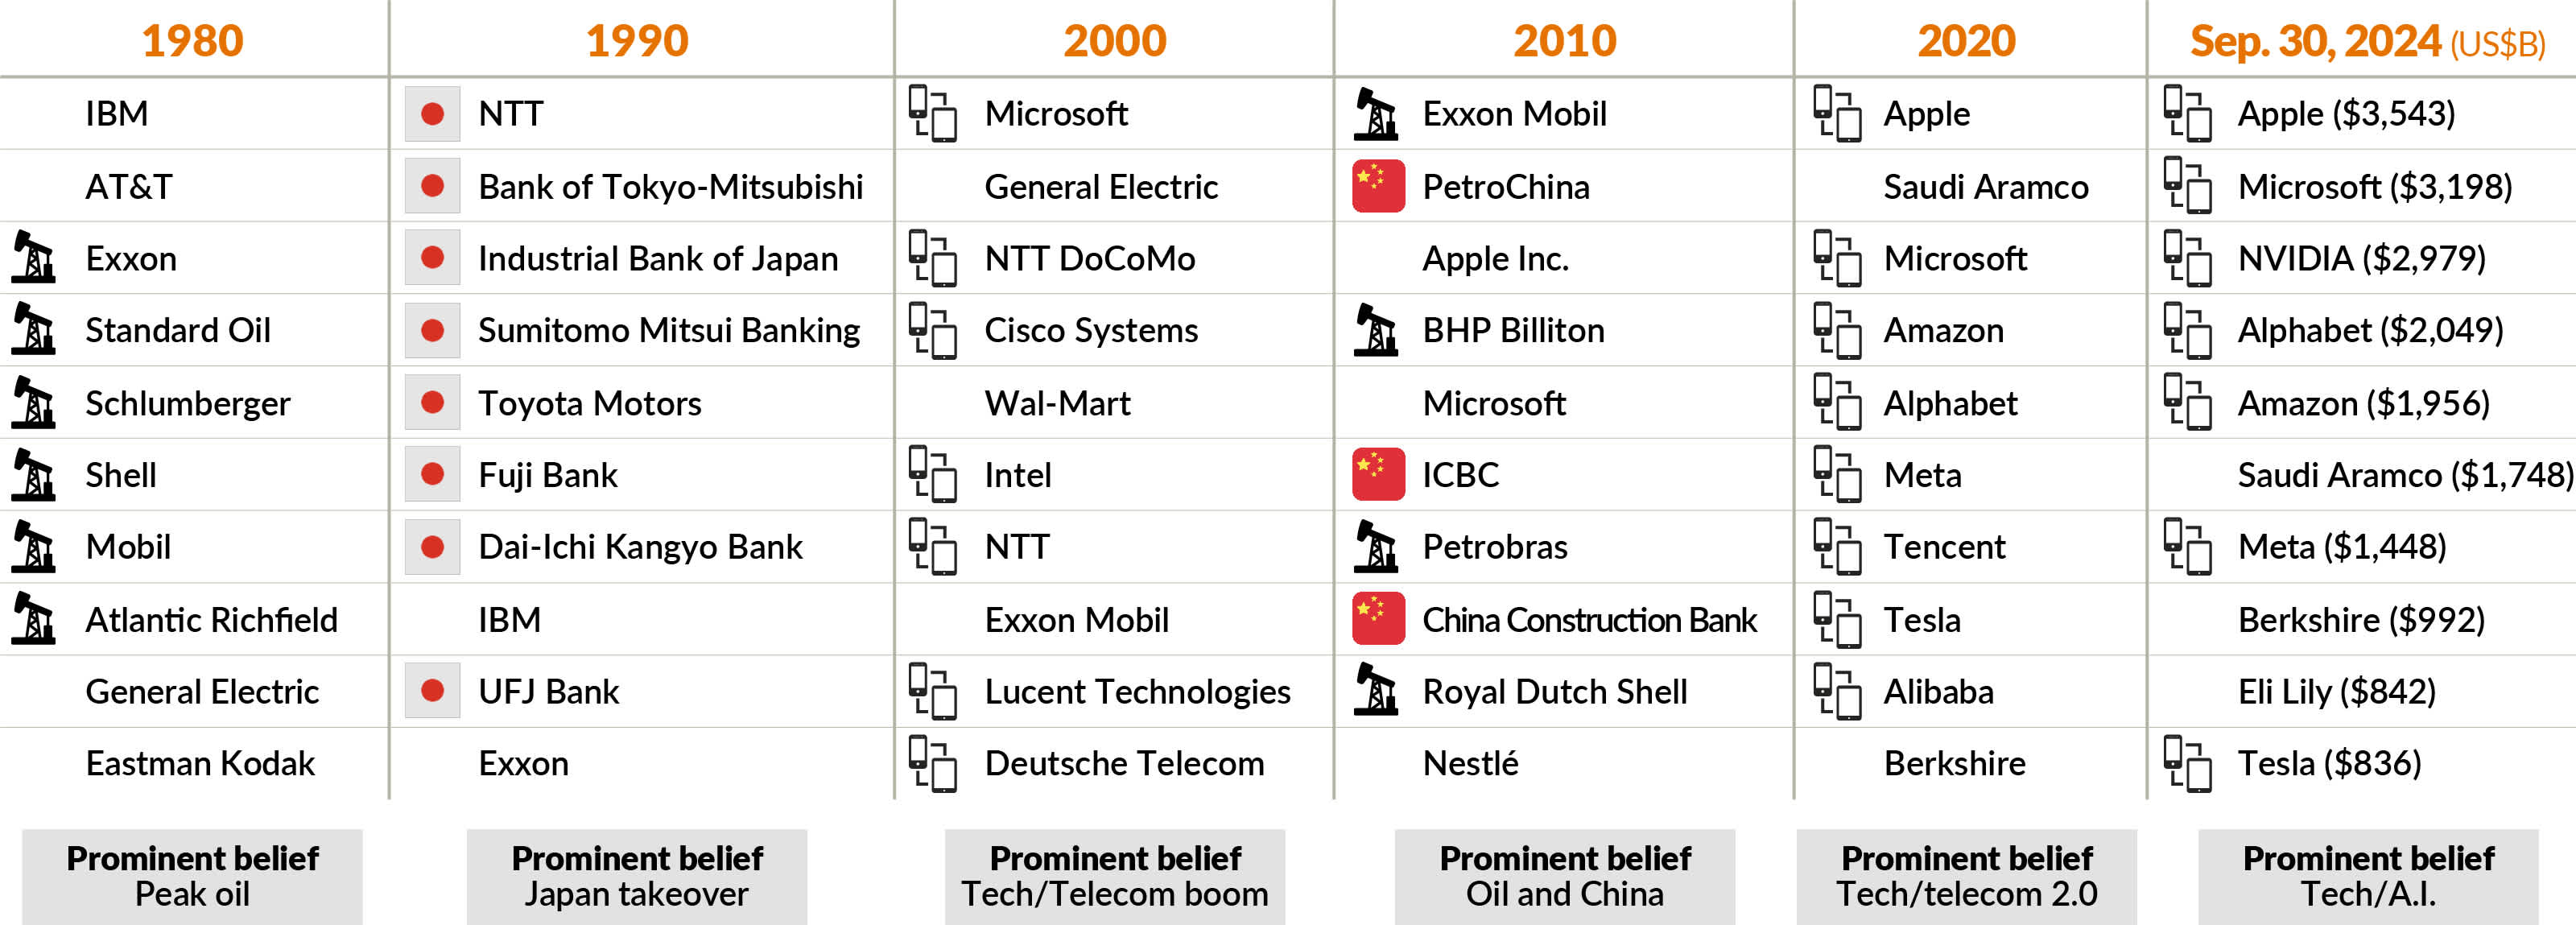
Investors following trends isn’t new. Looking at the 10 largest companies by market cap for each decade shows a theme. They’re often the biggest because they tend to benefit from the same secular shift. It went from energy (1980) to Japan (1990) to technology (2000) and then to China and commodities (2010) due to China’s rapid industrialization. The last few years have seen massive growth in technology companies – interestingly there’s a high overlap between the biggest companies in the world today and what’s widely owned in both global and U.S. equity funds.
Largest companies in the world by market cap
1980 to 2024
Source, decades: J. Mauldin, “Bonfire of the Absurdities”, Mauldin Economics, November 17, 2017. Source, 2020 & 2024: FactSet Research Systems Inc. Market cap in US$. The 2020 data is as at January 1, 2020.
Winners also don’t tend to stay on top forever. General Motors went from a 50% U.S. market share in automotive in the 1960s to around 15% today, and from being one of the biggest and most valuable companies in the world to bankruptcy in 2009.ii IBM was at the forefront of major tech such as mainframes in the 1960s to personal computers in 1981, yet they’ve been disrupted and displaced by new competition. While past performance isn't indicative of future performance, most global funds seem to be comfortable investing in these present-day front runners.
Wayne Gretzky had a saying, “Skate to where the puck is going to be, not where it has been.” This quote emphasizes the importance of future opportunities rather than reacting to past events. When it comes to investing, looking at the returns of the 10 largest U.S. stocks for the decades before and after they reached the top shows how true this saying is:
10 largest U.S. stocks by market cap – Total annualized excess returns relative to the U.S. market
This is a long period of data, 96 years running from 1927 to 2022. Let’s focus on the five- and 10-year periods before and after they hit the top 10. The left side of the chart shows how these up-and-coming companies outperformed the market by a compounded 12.1% over 10 years and 20.3% over five years. It’s like climbing Mount Everest, once you get to the summit the only direction is down. In the subsequent five- and 10-year periods, they tended to underperform between 0.9% and 1.5%, respectively, on an annual basis. If history is a guide, owning a lot of the current top 10 global companies can potentially prove disappointing for investors.
Dolly's Wall Street descendants – chasing momentum, and forgetting to think
In the last few years, markets have been driven by big technology companies. This was fueled by multiple factors such as a prolonged period of low interest rates, high government stimulus that became extreme during Covid, strong growth and investor speculation. Free money, combined with investor envy of those profiting in the market means that the lessons of financial history tend to get displaced by animal spirits. The result is that momentum builds in the market. Greater numbers of both professional and retail investors pile into the same select group of stocks.
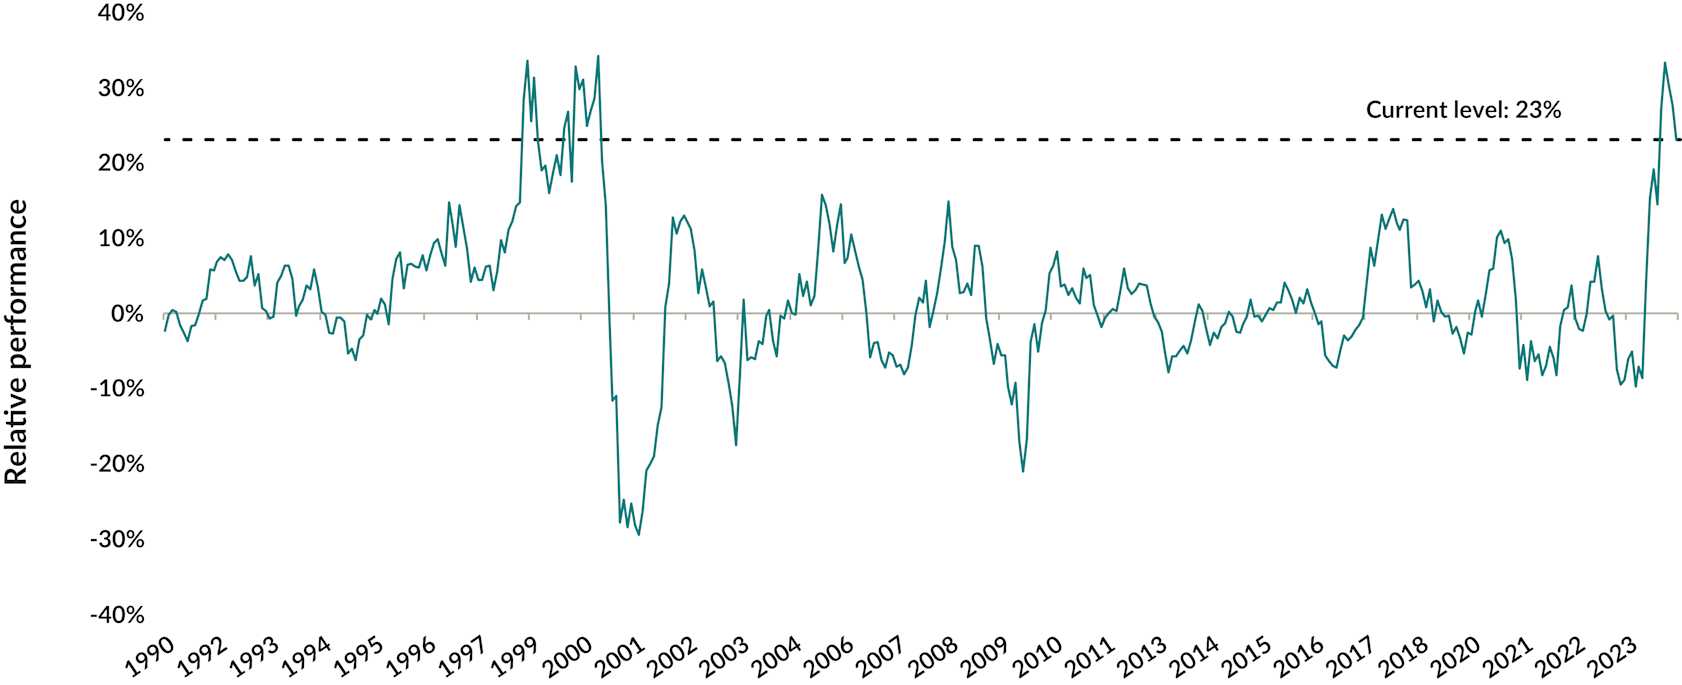
The exuberance from investors has its own gravity, fueling the trajectory of “momentum” stocks. The S&P 500 Momentum Index tracks stocks that meet a certain momentum score, meaning their ability to keep the same relative performance. Comparing it to the S&P 500 Index as a whole, these momentum stocks have only been more popular 4.2% of the time since 1990.
S&P 500 Momentum Index vs. S&P 500 Index – Rolling 12-month relative performance
Dec. 31, 1989 to Sep. 30, 2024
Source: Bloomberg LP. Total returns in US$. See Important information – indexes for additional details.
Aside from the past few months, the last time it was this popular was the late 1990s during the internet tech bubble. And it took 15 years for the Nasdaq to recover and more than seven years for the S&P 500 Index.iii
Rise of the clones – equity funds trapped in the same DNA
Momentum investing recognizes that the market has spotted a trend in a stock’s price direction. It’s also the opposite of the EdgePoint approach, which seeks to identify companies where we have proprietary insights reflecting positive change in the business not yet reflected in a company’s valuation. In short, we strive to buy growth without paying for it.
What’s EdgePoint doing today? Morningstar, according to its Style Classification, categorizes EdgePoint Global Portfolio as investing in medium-sized companies using a blend of value and growth styles (or what we call “buying growth without paying for it”). Our Global Equity peers are mirroring the market, with 45 funds (or 96%) classified as large cap and 22 (47%) as large-cap growth.
Global Equity category (Canadian funds) – # of funds by Morningstar Style classification
As at Sep. 30, 2024
Source: Morningstar Direct. As at September 30, 2024. Only Global Equity category funds with a minimum AUM of C$1 billion. Fund of funds and duplicated series are excluded. The two funds in the mid capitalization blend category are EdgePoint Global Portfolio and CI Global Leaders Fund. See Important information – Global Equity category for additional information.
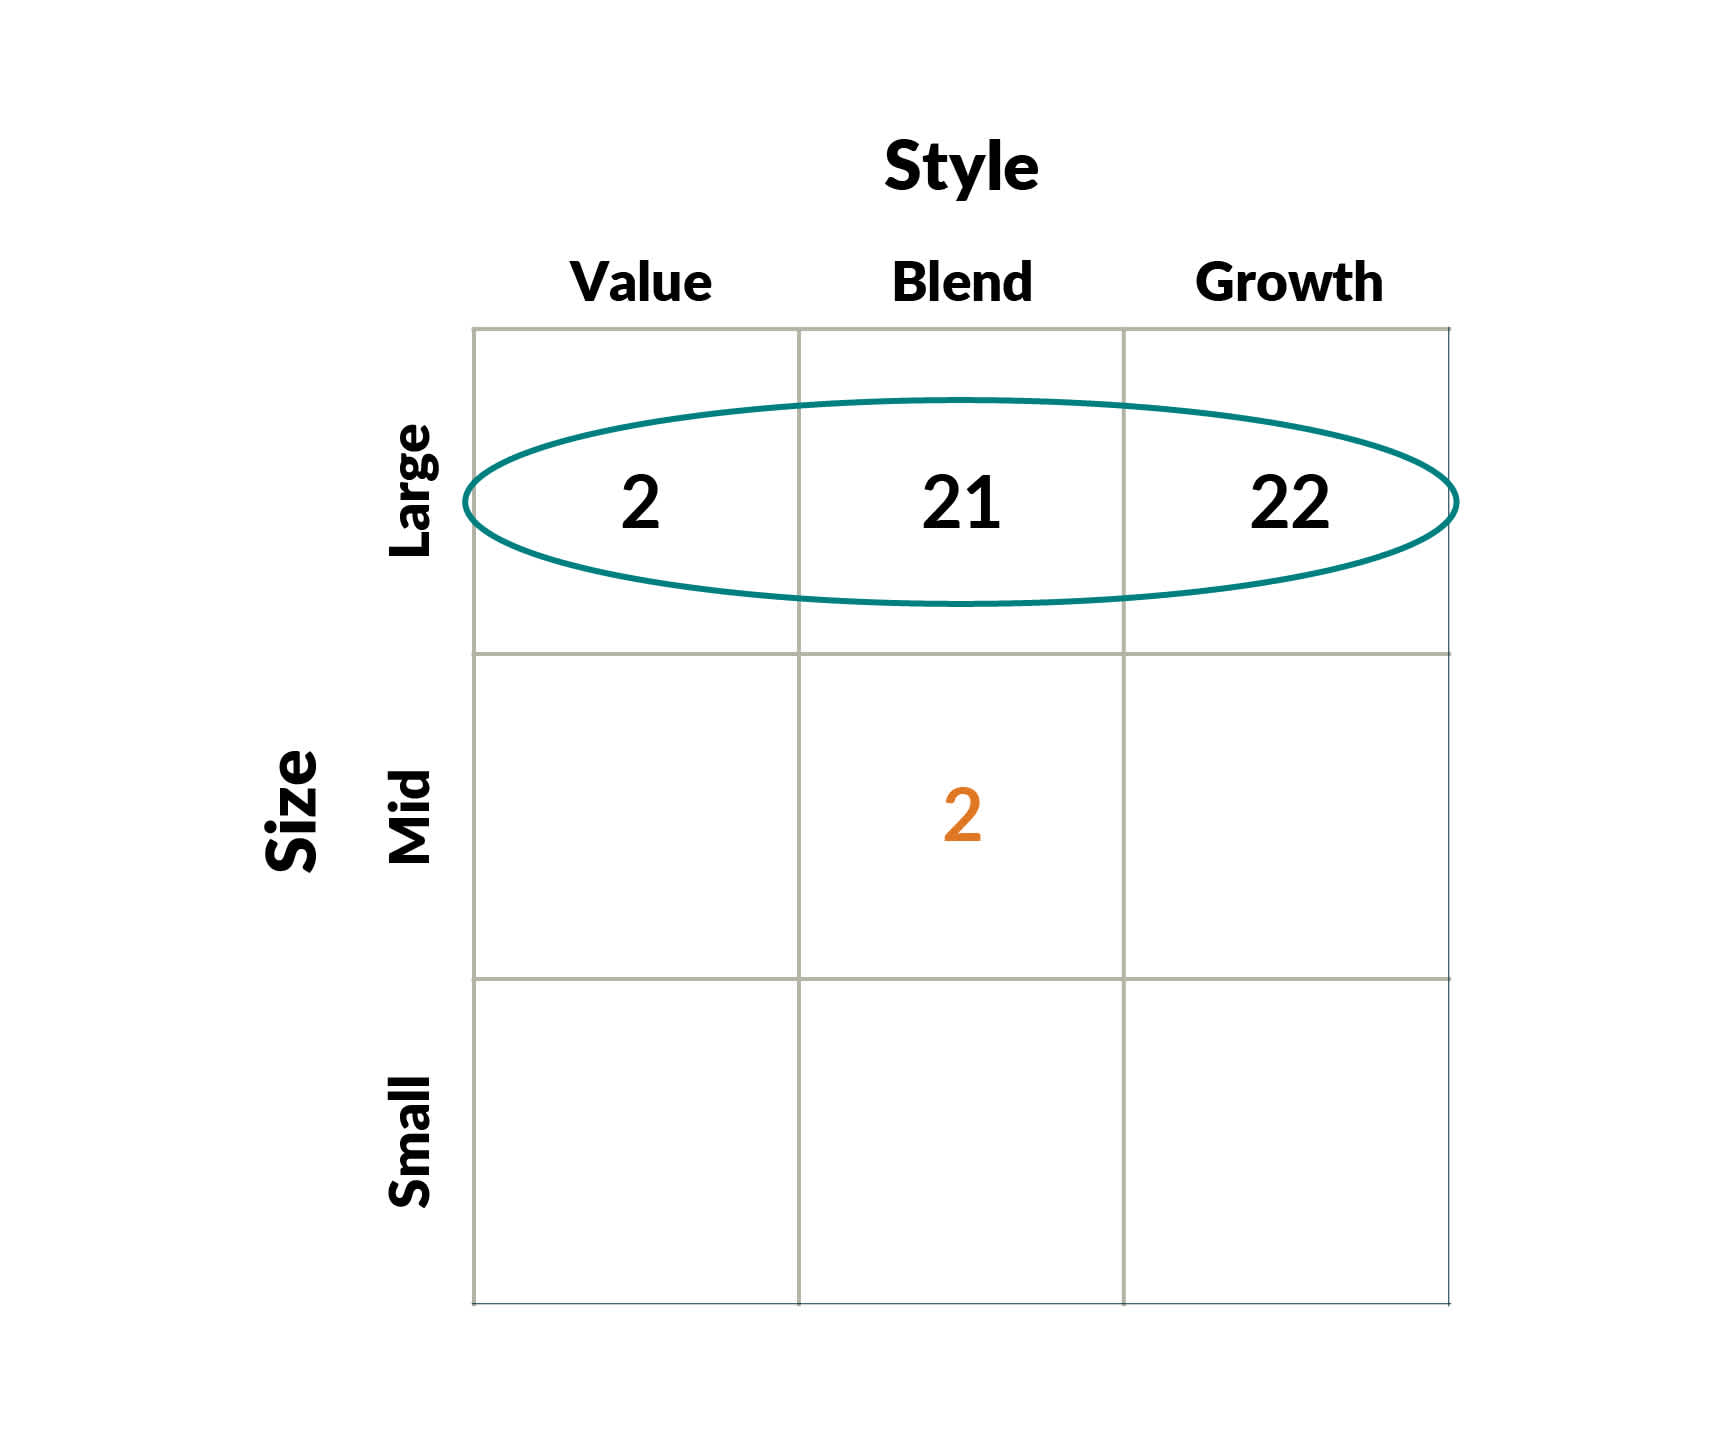
EdgePoint Global Portfolio is one of only two Global Equity funds that’s invested predominantly outside of large caps – not just for the sake of being contrarian, but rather because it’s where we’re seeing the best opportunities.
A year ago, I discussed how mid-cap stocks were trading at a 40% valuation discount across several metrics. The last time they were at these levels was in the early 2000s, and over the subsequent 13 years midcaps tripled, and large caps were flat. Funds aren’t investing in these midcaps because they’re either an immaterial weight or not even held in the MSCI World Index.iv
S&P 100 Index vs. S&P 400 MidCap Index – Relative valuations (average)
Dec. 31, 1999 to Sep. 30, 2024
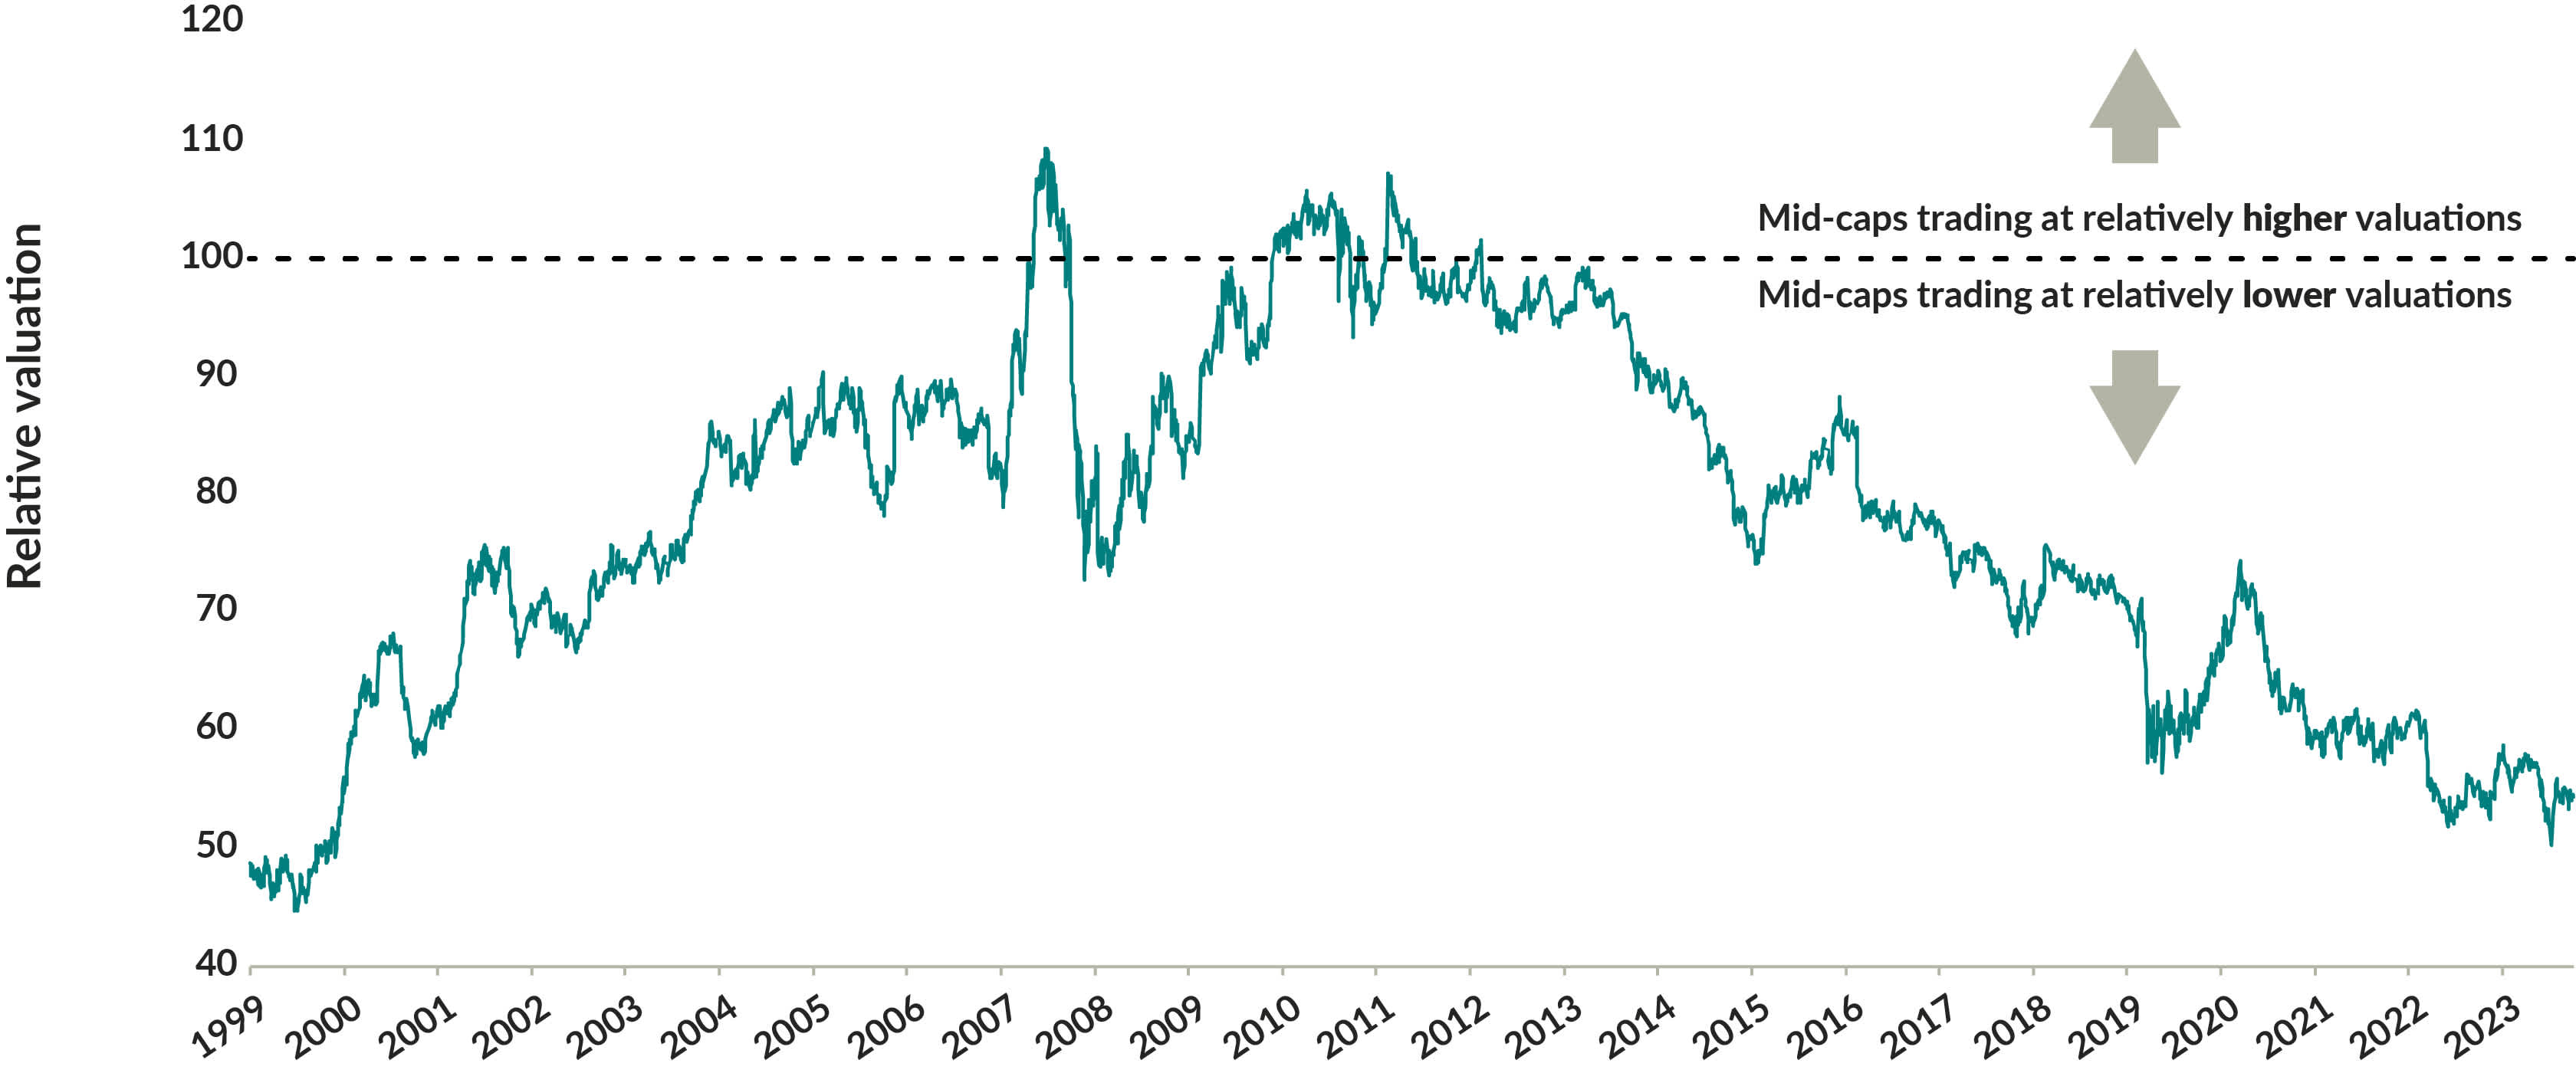
Source: FactSet Research Inc. As at September 30, 2024. Relative valuations are the daily average of five valuation metrics for the two indexes: price-to-earnings ratio, price-to-book-value ratio, price-to-cash-flow ratio, price-to-sales ratio and enterprise value-to-earnings before interest, taxes, depreciation and amortization. See Important information – Indexes for additional details.
The popularity of large caps, especially growth stocks, has resulted in high valuations today relative to the average over the last 20 years. Large-cap companies, irrespective of style category, are trading at premiums between 21% and 49% on average:
Valuations by Russell style indexes – Current price-to-earnings ratio premium/discount as a % of 20-year average
As at Sep. 30, 2024
Source: JPMorgan Market Update. As at September 30, 2024. See Important information – Global Equity category for additional details.
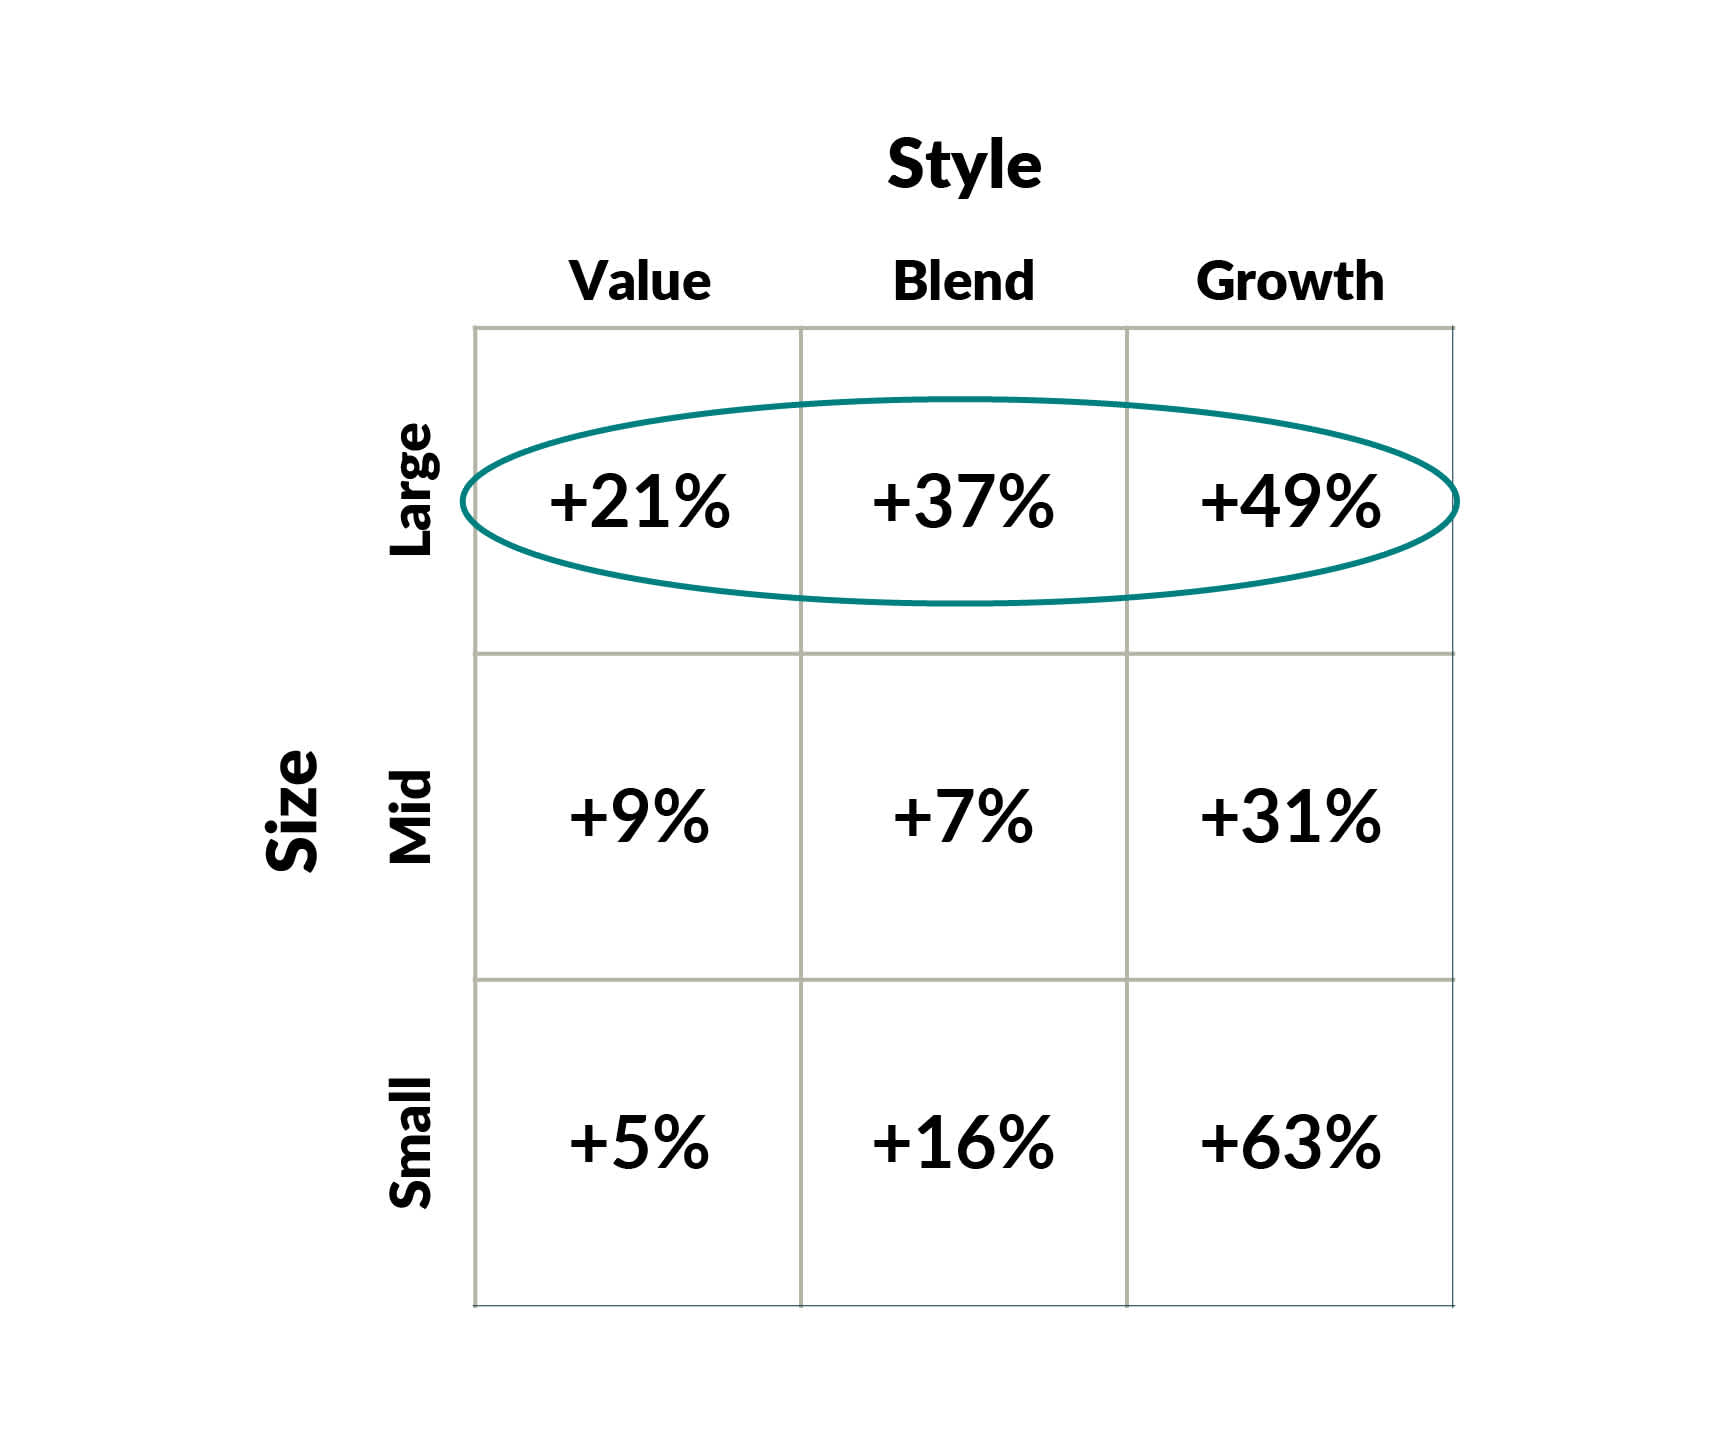
Around 95% of Global Equity funds are invested in these large-cap companies. They’re crowded here irrespective of high valuation, just like sheep herding in a farmer’s field. In contrast, EdgePoint Global Portfolio is situated in the mid-blend box where the premium is only 7%. One of the important factors of getting pleasing future returns is an attractive (i.e., low) entry price today. Conversely high prices today will likely translate into disappointing future returns.
EdgePoint Global Portfolio’s weighted average market cap is C$83 billion compared to averages of C$753 billion for the 10 largest equity funds or C$814 billion for the 10 top-selling funds.v
Weighted average market cap (C$B)
Of the approximately 60,000 publicly traded companies, only 14 companies globally have a market valuation of $750 billion or more.vi Many of the names should be familiar since they’re what many other Global Equity funds own: Apple, Meta, Google, Microsoft, Nvidia, Amazon, Broadcom. These household names are the biggest companies in the world, but the important question is, how much bigger can they get? For investors to experience growth, their investments need room to grow. If, on average, the companies in EdgePoint Global Portfolio tripled from today’s level, they would still be less than one-third of the average market cap of our largest competitors.
Orange is the new black (sheep)
Our investment discipline, which goes back over 50 years throughout all kinds of markets, economic cycles and investment trends, has stood the test of time and has generally outperformed the index. EdgePoint employees understand the role that the willingness to stand apart from the herd played in that relative outperformance. It’s why we’re the largest investors in EdgePoint’s Portfolios and have C$398 million invested alongside our clients.vii
Taurus Fund, Series FE vs MSCI World Index
Dec. 31, 1971 to Apr. 30, 1981

Trimark Fund, Series SC vs MSCI World Index
Sep. 1, 1981 to Dec. 31, 2007

EdgePoint Global Portfolio, Series A vs MSCI World Index
Nov. 17, 2008 to Sep. 30, 2024
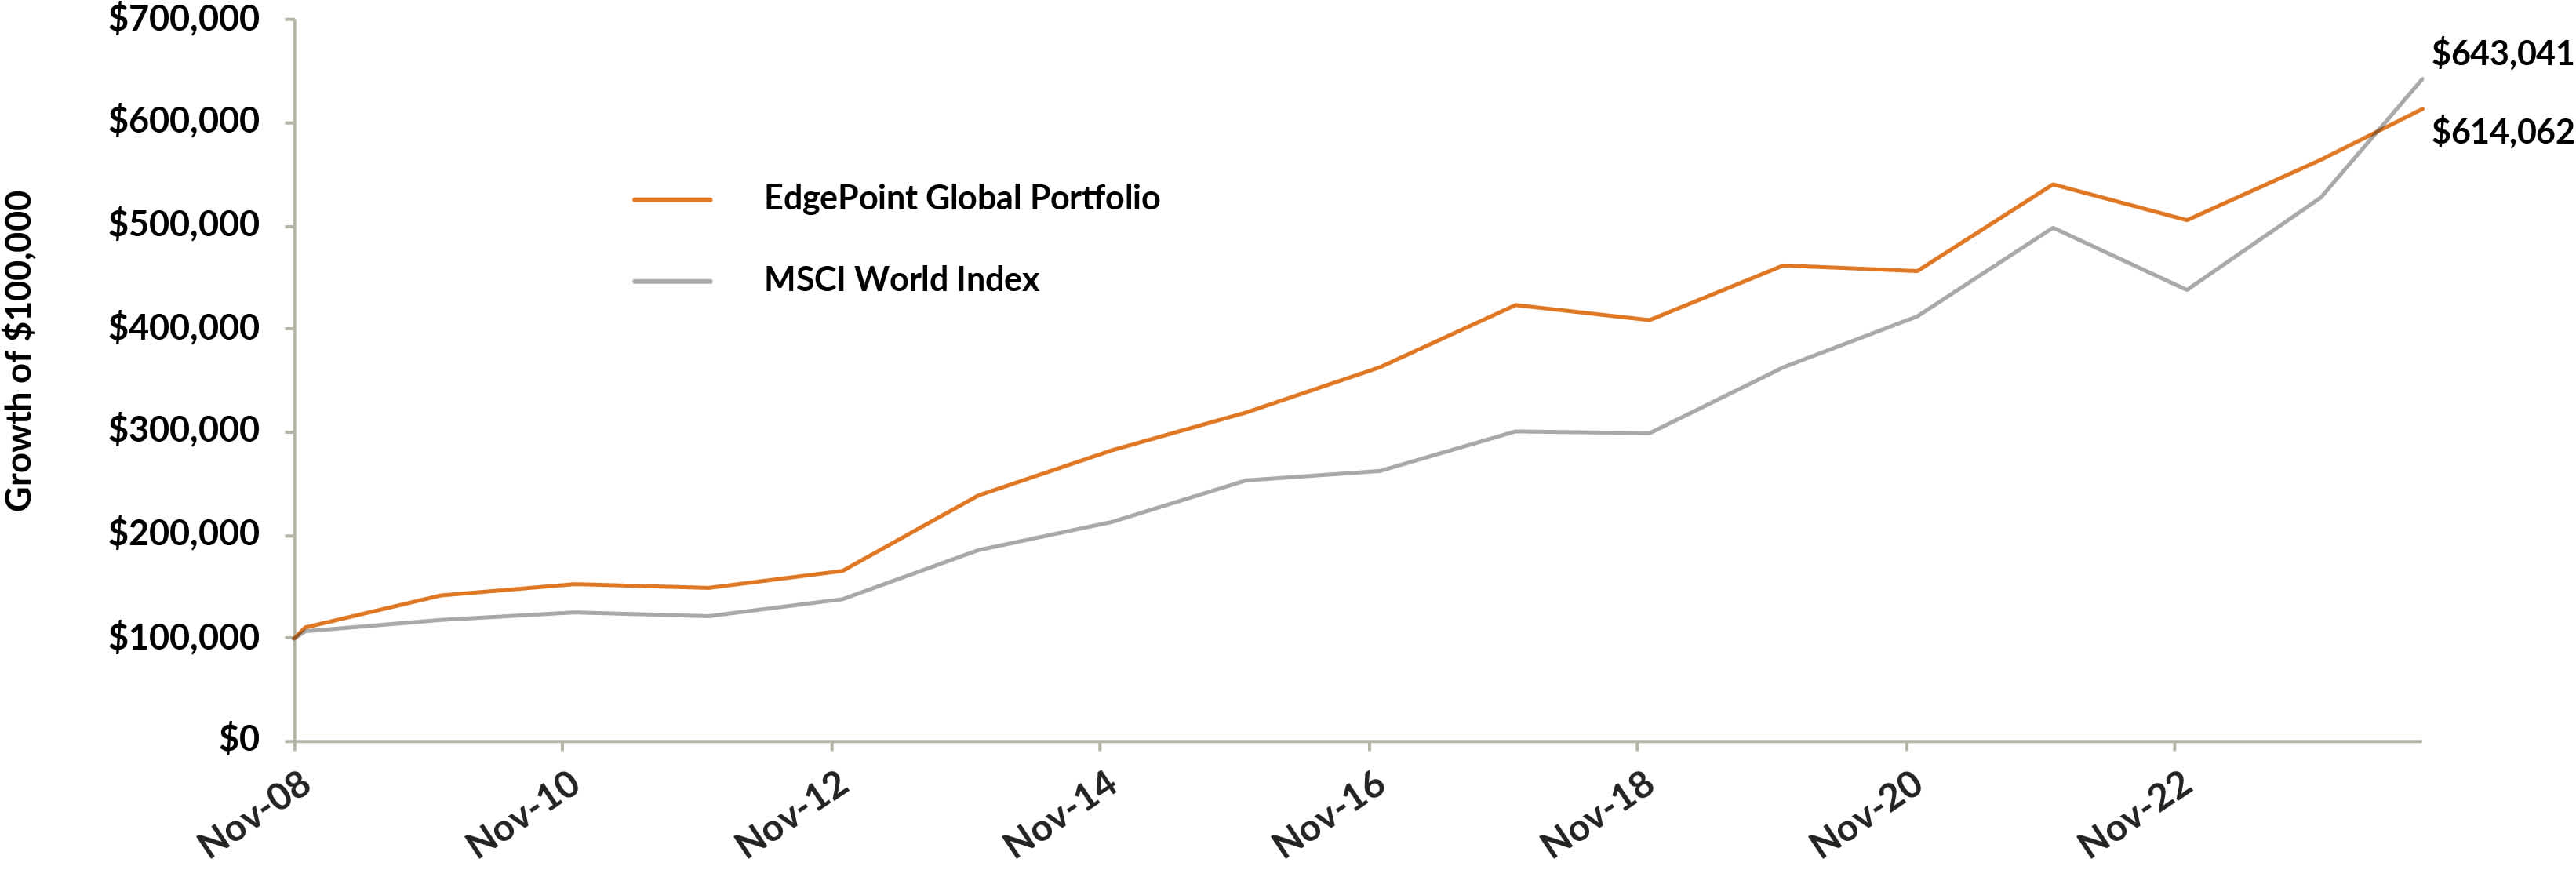
Portfolio performance as at September 30, 2025. Annualized total returns, net of fees, in C$
EdgePoint Global Portfolio, Series A: YTD: 11.98%; 1-year: 12.04%; 3-year: 15.39%; 5-year: 11.11%; 10-year: 8.43%; 15-year: 11.23%; Since inception (Nov. 17, 2008): 12.11%. Invesco Global Companies Fund, Series SC*: YTD: 10.12%; 1-year: 14.09%; 3-year: 21.07%; 5-year: 10.58%; 10-year: 9.34%; 15-year: 10.64%; Since inception (Sep. 1, 1981): 11.07%. MSCI World Index**: YTD: 13.61%; 1-year: 20.76%; 3-year: 24.23%; 5-year: 15.35%; 10-year: 12.84%; 15-year: 13.31%; Since EdgePoint Global Portfolio’s inception (Nov. 17, 2008): 12.92%.
Note: The Taurus Fund is no longer in existence.
*As at July 27, 2018, Trimark Fund changed its name to Invesco Global Companies Fund.
**As at October 17, 2016 the Trimark Fund changed its benchmark to the MSCI All Country World Index. Source, MSCI and Trimark: Morningstar Direct. Source, EdgePoint: Fundata Canada Inc.
Source, MSCI and Trimark returns: Morningstar Direct. Source, Taurus: Bolton Tremblay Funds Inc. 1982 Annual Report. The above values are for illustrative purposes only and do not represent an actual client’s results. Total annual returns, net of fees, measured in C$. Historical performance is not indicative of future returns. The Taurus Fund, Trimark Fund and EdgePoint Global Portfolio are used for illustrative purposes only to demonstrate the history of the investment approach. All of the funds applied the same investment approach across different companies, investment teams and members for the periods shown. The MSCI World Index is a market-capitalization-weighted index comprising equity securities available in developed markets globally. The MSCI World Index was used for comparison purposes as it represents a broad global equity universe across several developed market countries. The index is not investible. The three Funds were managed independently of the index used for comparison purposes. Differences for all three Funds including security holdings, geographic/sector allocations and market cap size may impact comparability. See Important information – Indexes and Important information – Funds additional details.